Someone in the finance channel posts two screenshots side by side. On the left, the dashboard you built. On the right, the Shopify admin. The totals don’t match, and they’re not off by a rounding error either. They’re off by enough that nobody wants to use your dashboard for anything that matters.
The frustrating part is that the pipeline is fine. Webhooks are arriving, Lambda is running clean, S3 has the files, Athena returns rows. Nothing is broken in the way monitoring understands “broken”. The pipeline is faithfully recording something that is no longer true.
This post is about building a Shopify sales dashboard with AWS that survives that conversation. Not the wiring, which is well documented and mostly straightforward, but the design decisions that determine whether your numbers still hold up six months in. I’ll cover the three ingestion paths and when each one is the right call, why append-only pipelines drift, how to lay out S3 and Athena so recomputation is cheap, and what to do when the totals are already wrong.
Why a Shopify sales dashboard with AWS drifts from the admin
Here’s the thing that catches almost everyone: a Shopify order is not an event, it’s a mutable record.
An event pipeline assumes facts are immutable once written. A payment happened. A shipment left. You append it, you never touch it again, and the sum of the log is the truth. That model is why streaming architectures are so clean, and it’s exactly wrong for order data.
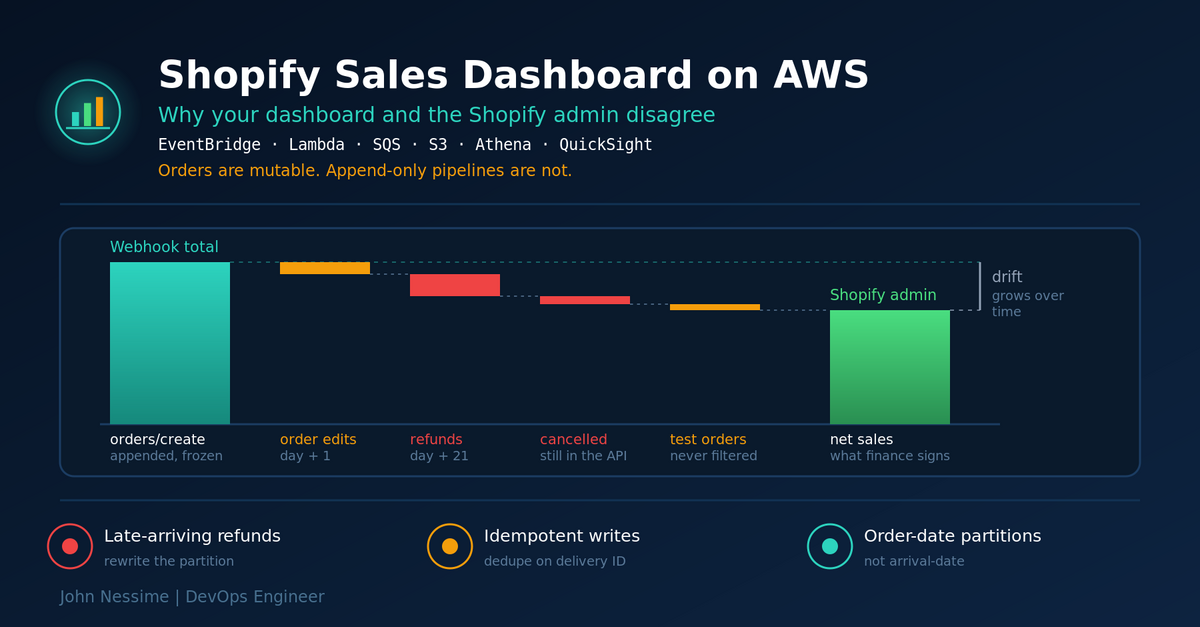
An order created on Monday can be edited on Tuesday, partially refunded on Friday, and fully refunded three weeks later. Every one of those changes belongs, financially, to Monday. If your pipeline appends the orders/create payload and never revisits it, Monday’s revenue is frozen at the moment of checkout and it will only ever be too high.
This is the invisible failure. Nothing alerts. No queue backs up. Your dashboard is confidently wrong, and the gap widens roughly in proportion to your return rate. A store with a two percent return rate takes a long time to notice. A fashion store running thirty percent returns notices in about a month, usually via an angry accountant.
The four adjustments that move historical numbers
- Refunds. Full or partial. A refund carries its own
created_at, which is when the money moved back. The order it belongs to has a different, earlier date. You need both, and which one you attribute to depends on whether finance wants cash-basis or order-basis reporting. Ask before you build. - Order edits. A merchant adds a line item or adjusts a quantity after the fact. The original payload is now stale. Shopify exposes both the original and the current totals precisely because of this.
- Cancellations. A cancelled order keeps existing in the API. If you filter only on payment status you will happily keep counting it.
- Test and draft orders. Test orders carry a flag marking them as such. Nobody remembers to filter these until a QA run during a quiet week produces a suspicious spike.
The design consequence is simple to state and annoying to implement: your pipeline must be able to recompute any past day. Every storage and partitioning decision below follows from that one requirement.
Getting data out of Shopify: three paths, three trade-offs
Before anything else: new Shopify apps are built on the GraphQL Admin API. The REST Admin API has been designated a legacy API and new public apps must use GraphQL. If you’re starting fresh, start there. If you inherited a REST integration, it probably still runs, but you’re on borrowed time and you should plan the migration rather than discover the deadline.
Path 1: EventBridge partner event source
Shopify can deliver webhooks straight into an Amazon EventBridge partner event bus in your account. No public endpoint, no API Gateway, no HMAC verification code, because verification only applies to HTTPS deliveries. Shopify’s own docs confirm EventBridge and Pub/Sub deliveries skip it.
You create the source in the Shopify app configuration using your AWS account ID, region and a source name, then associate it with an event bus in the EventBridge console and write rules to route it. The address you register with Shopify is the partner event source ARN, not the event bus ARN. That distinction accounts for a large share of the “I set it up and nothing arrives” threads on the Shopify forums.
A rule matching everything from the Shopify partner source looks like this. Start broad, then narrow once you’ve seen the real shape of an event:
{
  "source": [ { "prefix": "aws.partner/shopify.com" } ]
}
Send that to an SQS queue with a dead-letter queue attached rather than straight to Lambda. Buffering gives you a replay buffer when a downstream deploy goes wrong, and the DLQ means a bad payload parks itself instead of poisoning the whole rule. This is the path I reach for first for anything already on AWS.
Path 2: HTTPS webhooks into API Gateway and Lambda
The conventional route, and the right one if you need webhook delivery outside AWS too, or you want the payloads to pass through something you fully control. The cost is that you now own an internet-facing endpoint and the HMAC verification on it.
Verify against the raw request body, before any JSON parsing. Re-serialising the payload changes byte-for-byte content and the signature will never match. Use a constant-time comparison so the check doesn’t leak timing information:
import base64, hashlib, hmac

def verify(raw_body: bytes, header_hmac: str, secret: str) -> bool:
    digest = hmac.new(secret.encode(), raw_body, hashlib.sha256).digest()
    computed = base64.b64encode(digest).decode()
    return hmac.compare_digest(computed, header_hmac)
Shopify sends the signature in the X-Shopify-Hmac-SHA256 header, base64-encoded, computed with your app’s client secret over the raw body. Store that secret in Secrets Manager or as an SSM SecureString parameter, not in a Lambda environment variable.
Acknowledge fast. Shopify’s timeout is short and it retries with backoff over a finite window, so a handler that does real work inline will generate a wall of duplicate deliveries during a flash sale, exactly when you can least afford it. Return 2xx immediately, do the work asynchronously.
Path 3: scheduled GraphQL bulk pull
Webhooks give you low latency. They do not give you completeness. Anything that fails past its retry window is gone, and Shopify will eventually remove a subscription that keeps failing. That’s a silent data loss mode with no local symptom at all.
So run a scheduled reconciliation pull alongside the stream. Shopify’s GraphQL bulk operations are built for this: you submit a query, it runs asynchronously, and you fetch a JSONL result file when it finishes. That’s the right tool for backfills and nightly catch-up, rather than paginating thousands of pages against a points-based rate limiter and getting throttled halfway through.
A nightly job that re-pulls the last seven to fourteen days and overwrites those partitions costs almost nothing and quietly fixes every category of drift described above. If you build one thing from this post, build that.
Decide what “revenue” means before you write a line of SQL
This is where most reconciliation arguments actually live, and it isn’t an engineering problem at all until you’ve had the conversation.
Shopify’s own sales reporting builds total sales from gross sales, minus discounts, minus returns, plus taxes and shipping. Gift card sales sit outside that in a separate finance report. If your dashboard sums order totals and calls it revenue, you have built a different metric with the same name, and it will disagree with the admin forever no matter how good your pipeline is.
Write the definition down. Put it in the dashboard as a tooltip. When someone challenges a number, you want the argument to be about the definition, not about whether your infrastructure works.
The currency trap
If the store sells in more than one currency, the money fields split in two. Shopify exposes totals as a set containing both shop_money and presentment_money: the amount in the store’s base currency, and the amount the customer actually saw and paid.
Sum the presentment amounts across a multi-currency store and you get a number with no meaning at all, euros and yen added together as if they were the same unit. For a single reporting figure you want the shop-currency side. Keep the presentment amount and its currency code in the table anyway, because the day someone asks “how much did we actually sell in Germany”, you’ll want it and it is painful to backfill.
One caveat worth knowing: orders created through the API rather than through checkout can behave differently from native multi-currency checkout orders. If your store takes orders from an ERP or a marketplace integration, spot-check a few of those specifically.
Storage layout: partition by order date, never by arrival date
Two layers in S3. Keep them separate and keep them honest about what they are.
- Raw. Every payload exactly as received, partitioned by ingestion date. Append-only, never edited. This is your audit trail and your rebuild source. Lifecycle it to a colder storage class after a few months, don’t delete it.
- Curated. One row per order representing current state, in Parquet, partitioned by order date. This is what the dashboard queries. It is derived, disposable and rewritable.
The partitioning choice on the curated layer is the load-bearing decision in the whole design. If you partition by arrival date, which is what Amazon Data Firehose does by default because it buckets on the moment it writes the file, then a refund that arrives three weeks late lands in today’s partition. Correcting Monday now means finding and rewriting fragments scattered across twenty other partitions. Partitioned by order date, correcting Monday means overwriting exactly one prefix.
Firehose can do this with dynamic partitioning, which routes records by keys inside the payload rather than by write time. If you’re not using Firehose, extract the order date in your Lambda and write the prefix yourself.
Use partition projection so Athena stops guessing
The default Glue Data Catalog approach means running a crawler or issuing MSCK REPAIR TABLE to register new partitions. Forget one and you get a query that silently returns nothing for recent days. Nobody notices until Monday.
Partition projection removes the metastore lookup entirely. You tell Athena the shape of the partition keys and it calculates the prefixes at query time:
CREATE EXTERNAL TABLE shop_orders (
  order_id             bigint,
  order_number         string,
  created_at           timestamp,
  financial_status     string,
  cancelled_at         timestamp,
  is_test              boolean,
  total_shop           decimal(12,2),
  shop_currency        string,
  total_presentment    decimal(12,2),
  presentment_currency string
)
PARTITIONED BY (order_date string)
STORED AS PARQUET
LOCATION 's3://your-bucket/curated/orders/'
TBLPROPERTIES (
  'projection.enabled' = 'true',
  'projection.order_date.type' = 'date',
  'projection.order_date.format' = 'yyyy-MM-dd',
  'projection.order_date.range' = '2019-01-01,NOW',
  'projection.order_date.interval' = '1',
  'projection.order_date.interval.unit' = 'DAYS',
  'storage.location.template' =
    's3://your-bucket/curated/orders/order_date=${order_date}/'
);
Set the range start to your store’s actual first order month. Projection generates every prefix in the range, so a range starting a decade too early makes wide scans slower for no benefit.
Parquet matters here for the same reason. Athena bills on bytes scanned, so a columnar format with good compression cuts the bill directly, and a dashboard that only ever selects six columns from a forty-column table never touches the rest.
Net sales in one query
With refunds in their own table keyed by order and carrying their own date, attributing them back to the original order day is a left join and a subtraction:
SELECT
    o.order_date,
    SUM(o.total_shop)                                AS gross_shop,
    SUM(COALESCE(r.refunded_shop, 0))                AS refunded_shop,
    SUM(o.total_shop - COALESCE(r.refunded_shop, 0)) AS net_shop
FROM shop_orders o
LEFT JOIN (
    SELECT order_id, SUM(amount_shop) AS refunded_shop
    FROM shop_refunds
    GROUP BY order_id
) r ON r.order_id = o.order_id
WHERE o.order_date BETWEEN '2025-01-01' AND '2025-01-31'
  AND o.is_test = false
  AND o.cancelled_at IS NULL
GROUP BY o.order_date
ORDER BY o.order_date;
Note the two filters doing quiet work at the bottom. Those two lines are the difference between a number finance accepts and a number they don’t.
Choosing the dashboard layer
Once the data is correct, this part is genuinely a preference. All of these work.
- Amazon QuickSight, now delivered as part of Amazon Quick Suite, is the least-friction option if you’re already in AWS. Its in-memory SPICE layer means viewers aren’t firing an Athena query per chart interaction, which controls both latency and scan cost. Per-viewer pricing tends to be the deciding factor either way, so model it for your actual audience size before committing.
- Grafana with the Athena data source is a good fit if you’re already running Grafana for infrastructure and want commercial and operational panels on one screen. Grafana Cloud removes the hosting question if you’d rather not run it.
- Power BI makes sense when the finance team already lives in Microsoft 365 and models in DAX. The cross-cloud hop is real but manageable.
- Metabase or a self-hosted alternative on a small VPS from a provider like InterServer or Hetzner is the pragmatic answer for a handful of internal viewers, where per-seat BI licensing costs more than the entire pipeline.
The honest trade-off: managed BI costs more per month and saves you from becoming the person who patches the reporting server. Self-hosting inverts that. Neither is wrong, but pick deliberately rather than by inertia.
Troubleshooting: symptom to cause
Totals are consistently higher than the Shopify admin
Almost always refunds, cancellations or test orders. Check in that order. If the gap grows with the age of the reporting window, it’s refunds. If it’s a fixed offset on specific days, look for test orders or a QA run.
Totals are lower, and recent days are missing rows
Either partitions aren’t registered, which projection fixes permanently, or the webhook subscription has been dropped after repeated delivery failures. Check the subscription still exists before you go digging through Lambda logs. A nightly bulk pull would have masked this, which is another argument for having one.
Orders appear twice
Shopify’s delivery model is at-least-once, not exactly-once, and you may also have more than one subscription on the same topic. Deduplicate on the delivery ID header before you touch anything else, and make the write itself idempotent so a duplicate is a no-op rather than a second row.
Numbers are right on the daily view, wrong on the monthly
Timezone. Order timestamps carry an offset; your partition key is a date string. If you derive the date in UTC and the store reports in a local timezone, orders near midnight land on the wrong day. That averages out over a month, which is exactly why the discrepancy hides until month boundaries.
Athena costs jumped without more data
Someone built a dashboard with a filter that doesn’t hit the partition column, so every panel refresh scans the full table. Look at bytes scanned per query and check whether the BI tool is caching results or re-querying on every interaction.
Common mistakes
- Treating orders as immutable events and never revisiting a past day.
- Partitioning on arrival time because that’s the default, then discovering corrections are expensive.
- Verifying the HMAC against a re-serialised body instead of the raw bytes.
- Doing real work inside the webhook handler, generating duplicates under load.
- Summing presentment amounts across currencies.
- Registering the event bus ARN with Shopify instead of the partner event source ARN.
- Relying on webhooks alone with no scheduled reconciliation.
- Shipping a “revenue” number without ever defining what it includes.
Best practices
- Keep raw and curated layers separate. Raw is append-only; curated is rewritable.
- Make every partition idempotently rebuildable from raw. Test that path deliberately, before you need it.
- Buffer through SQS with a dead-letter queue. Free replay, free isolation of bad payloads.
- Run a nightly bulk pull over a rolling window and overwrite those partitions.
- Use partition projection. It removes an entire category of silent failure.
- Alarm on the absence of events, not just on errors. A CloudWatch alarm on zero orders processed in an hour during business hours catches broken subscriptions the same day.
- Store the API secret in Secrets Manager and scope the Lambda role to the exact prefixes it writes.
- Publish a reconciliation panel comparing your total to the admin’s for the same window. Surfacing the gap builds more trust than hiding it.
Frequently asked questions
Do I need a data warehouse, or is S3 and Athena enough?
For a single store’s order data, S3 with Athena is almost certainly enough, and it’s cheaper because you pay per query rather than for a running cluster. Redshift starts to earn its place when you’re joining Shopify data against several other large sources, or when concurrent query load makes Athena’s queue times noticeable.
How near-real-time can this be?
Events land within seconds. The practical floor is your buffering window, since writing one tiny file per order gives you a small-files problem that ruins query performance. A few minutes of buffering is the usual compromise. If you genuinely need sub-minute order counts, put a live counter in DynamoDB alongside the analytical pipeline rather than trying to make the data lake do both jobs.
Which webhook topics should I subscribe to?
At minimum, order creation, order update, order cancellation and refund creation. Update and refund topics are the ones people skip, and they’re exactly the ones carrying the corrections. Subscribe to fewer topics than you think you need and add rather than subscribing to everything, since every extra topic is volume you pay to store and process.
Can I skip AWS and use a connector tool?
Yes, and for many stores that’s the right answer. A managed connector into a hosted warehouse gets you a working dashboard in an afternoon. You’re paying a monthly fee to avoid owning any of this, and trading away control over the data model. Building it on AWS wins when you need Shopify data joined to systems the connector doesn’t cover, or when row-based connector pricing outgrows the infrastructure cost.
How do I backfill historical orders?
Use a GraphQL bulk operation rather than paginating the API. Submit the query, poll for completion, then stream the JSONL result into your raw bucket and run the same transformation your live pipeline uses. If backfill and live processing use different code paths, they will diverge, and you’ll spend an afternoon working out which one is lying.
What does a setup like this cost to run?
For a typical single store, the pipeline itself is small money: Lambda invocations, a few gigabytes in S3, and Athena billed on bytes scanned, which partitioning and Parquet keep low. The BI seats are usually the largest line item, which is why the dashboard layer decision deserves more thought than the ingestion one. Model it against current published rates rather than trusting any figure you read in a blog post, including this one.
The one thing to take away
A Shopify sales dashboard with AWS doesn’t fail because the pipeline breaks. It fails because the pipeline keeps working perfectly on data that has since changed underneath it.
Design for correction from the first commit. Partition by order date, keep the raw layer so you can always rebuild, run a scheduled pull to catch what the stream missed, and agree on what revenue means before anyone builds a chart. Do that and the Monday morning screenshot comparison becomes a non-event, which is the highest praise a reporting pipeline ever gets.
Need help with your Shopify data pipeline on AWS?
I design and build ecommerce data pipelines and reporting stacks on AWS. Typical engagements look like:
- Working out why an existing Shopify dashboard disagrees with the admin, and fixing the root cause rather than patching the query
- Building the ingestion layer end to end: EventBridge or API Gateway, Lambda, SQS with dead-letter handling, and a scheduled GraphQL bulk reconciliation job
- Designing the S3 layout, Glue schema and Athena tables so past days can be recomputed cheaply and partitions never go missing
- Migrating REST Admin API integrations to GraphQL before the deadline forces the issue
- Building the dashboard itself in QuickSight, Grafana or Metabase, including the metric definitions finance will actually sign off on
- Cutting Athena scan costs and BI licensing on a reporting stack that has grown more expensive than anyone planned
If you’re in the middle of one of these, send me the actual thing: the Athena query, the S3 prefix layout, the two totals that don’t match. It’s a much faster conversation than describing it in the abstract.