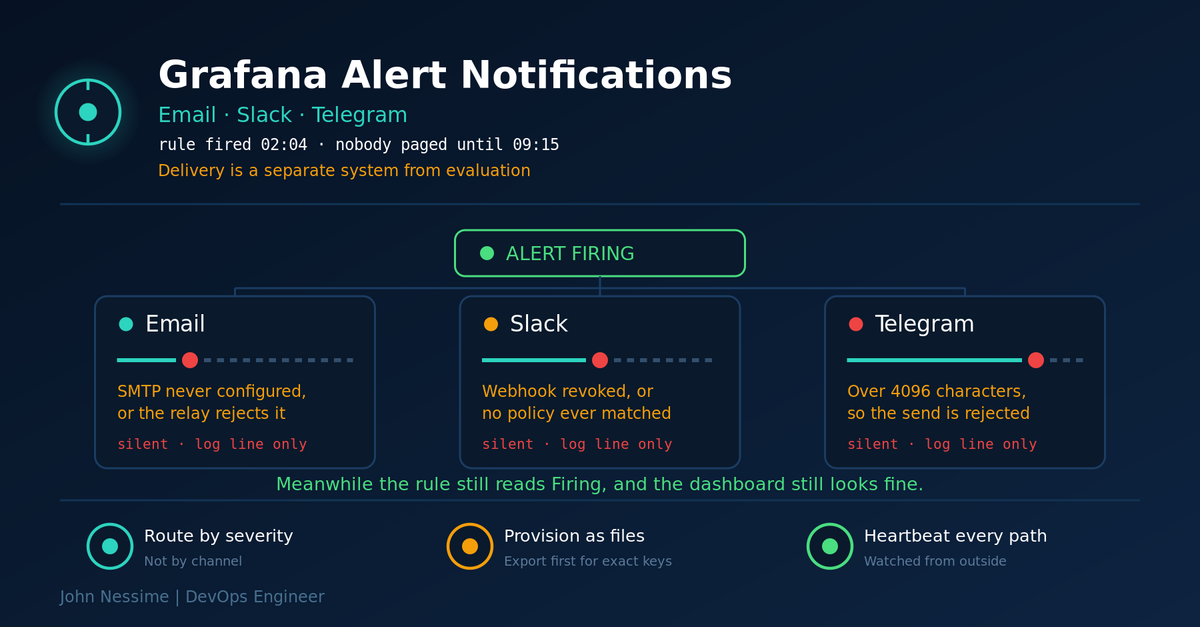
The disk filled at 02:00. The rule went red at 02:04. Nobody found out until 09:15, when someone opened the alert list, saw a Firing rule with a five-hour age on it, and asked the obvious question: why didn’t anyone get paged?
The rule was fine. The query was fine. The evaluation ran on schedule and the state transition happened exactly when it should have. What failed was everything after that, and none of it made a sound.
That is the failure mode worth designing around. Rule evaluation and notification delivery are two different systems, and a red rule only proves the first one works. Grafana alert notifications run against SMTP servers, Slack’s API and Telegram’s bot endpoint, all of which fail in their own quiet ways. A rejected login, a revoked webhook, a message over a length limit: each produces a log line and nothing else. The alert list still shows the rule firing, so everything looks healthy from the one place you’d think to check.
This post covers the practical setup for the three channels most small and mid-sized teams actually use: email, Slack and Telegram. It covers what breaks in each of them, how to route alerts so the right ones interrupt people and the rest don’t, how to provision the whole thing as files instead of clicking through the UI, and how to detect the case where delivery has stopped entirely.
Where a firing alert actually goes
Before touching any integration, it helps to know how many hops sit between “the rule fired” and “my phone buzzed”.
- The rule evaluates on its own schedule and produces alert instances, each carrying labels.
- Those instances go to an Alertmanager. Grafana ships its own and can also use an external Prometheus Alertmanager.
- The Alertmanager applies mute timings, groups instances, and walks the notification policy tree for a match.
- The matched policy names a contact point, which holds one or more integrations.
- Each integration makes its own outbound call to a third-party service.
Steps one and two are visible in the Grafana UI. Steps three through five are where things go wrong, and they are visible only in logs. That asymmetry is the whole problem.
One thing worth knowing early: a contact point can hold several integrations at once, so a single contact point named critical can fire email, Slack and Telegram together. Building one contact point per channel instead makes routing much harder than it needs to be.
Email: the channel everyone assumes works
Email is the one people configure first and verify least. The catch is that the email contact point holds only the recipient addresses. The actual SMTP credentials live in grafana.ini, so a perfectly valid contact point can sit there doing nothing because the server underneath was never configured.
[smtp]
enabled = true
host = smtp.example.com:587
user = alerts@example.com
# Wrap the password in triple quotes if it contains # or ;
password = """your-smtp-password"""
from_address = alerts@example.com
from_name = Grafana Alerts
skip_verify = false
# Default is OpportunisticStartTLS
startTLS_policy = MandatoryStartTLS
Several details in that block matter more than they look.
- The port is part of
host. There is no separate port setting. Port 587 with STARTTLS is the normal choice; 465 is implicit TLS and behaves differently, which is usually why one fails cleanly and the other hangs. startTLS_policydecides how hard Grafana insists on encryption. The default is opportunistic: it upgrades the connection if the server offers it and quietly continues in the clear if not. On a relay you control, mandatory turns a silent downgrade into a visible failure.from_addresshas to be something the relay accepts. Managed relays reject mail from unverified domains after the connection succeeds, which is why the Grafana side looks fine.- Leave
skip_verifyfalse. It exists for internal relays with self-signed certificates. Turning it on to clear an error removes the check that was telling you the certificate is wrong.
Changes to this file need a Grafana restart. Nothing in the UI reloads SMTP settings.
Deliverability is a separate problem from delivery
Sending directly from a VPS is the fastest way to get alerts filed as spam. A fresh IP range from a provider like Contabo or InterServer has no sending reputation, and a mail server that emits one message a week during incidents never builds one.
Point Grafana at a transactional relay instead. Amazon SES, Postmark, Mailgun and Brevo all do the same job at this volume. Whichever you pick, publish SPF and DKIM records for the sending domain and set a DMARC policy, then send a real alert to a Gmail address and a Microsoft 365 address and check the spam folder. That is the only test that tells you anything.
Slack: webhook or bot token
Grafana supports two ways of posting to Slack, and the choice has consequences beyond setup time.
Incoming webhooks are the quick path. Slack generates a URL under hooks.slack.com/services/ that is bound to a single channel, and Grafana posts to it. There’s no OAuth flow and no scopes to reason about. The trade-off is that the URL is the credential and it maps to exactly one channel, so a team with six alert channels ends up managing six secrets with no central view of them.
A Slack app with a bot token takes longer. You create the app, add the chat:write.public scope so it can post to public channels without being invited to each one, then copy the bot user OAuth token, which starts with xoxb-. In Grafana you supply that token plus the channel ID as the recipient. One credential covers every channel, permissions are visible in one place, and revoking it kills all posting at once.
Webhooks win when you have one or two channels and want to be done in five minutes. The bot token wins as soon as channels start multiplying or someone asks what the integration is permitted to do. I reach for the webhook on small setups and regret it around the fourth channel.
Two constraints either way. A Slack integration targets one channel, so several channels means several integrations. And notification templates control the message title and body text, not its visual structure, so rich block layouts aren’t on the table.
Telegram: cheap paging, one nasty edge
Telegram is genuinely useful for out-of-hours alerts because it pushes to a phone without anyone paying for a paging product. The setup is two values: a bot API token and a chat ID.
- Message BotFather and send
/newbot. The username has to end inbotor_bot. - Copy the HTTP API token it returns. That’s the bot API token Grafana wants.
- Create a group for alerts and add the bot to it. A bot cannot message a chat it has never seen.
- Send a slash command in the group, such as
/start@your_bot_name. An explicit command is the reliable way to make the group visible to the bot. - Fetch the chat ID from the Telegram API.
curl -s "https://api.telegram.org/bot<YOUR_BOT_TOKEN>/getUpdates" | jq '.result[].message.chat'The id field in that output is what goes in Grafana’s Chat ID field. Group chat IDs are negative. Copy the minus sign; leaving it off is the single most common reason a Telegram contact point tests as failing.
Now the edge case, and it’s the reason Telegram belongs in a post about invisible failures. Telegram caps messages at 4096 UTF-8 characters. If you’re using a parse mode other than none, truncating at that boundary can leave the markup unbalanced, and Telegram rejects the whole message as malformed. You don’t get a shortened alert. You get nothing.
This is exactly backwards, because the message most likely to blow the limit is a large grouped alert during a real outage. The channel works perfectly for months of single alerts, then goes quiet the first time forty instances fire together. Three ways to deal with it, in the order I’d try them:
- Write a deliberately short notification template for Telegram: alert name, severity, instance count and a dashboard link. Treat it as a pager, not a report.
- Narrow
group_byon the policy that feeds Telegram so a single notification covers fewer instances. - Set the parse mode to none, which makes truncation harmless at the cost of formatting.
Routing: split by severity, not by tool
The most common design mistake is a policy tree organised around channels: a Slack policy, an email policy, a Telegram policy. That gives you no way to express the thing you actually care about, which is that some alerts should wake someone up and most should not.
Put severity on the alert rule as a label and route on that instead. Contact points then become bundles of channels chosen to match urgency.
severity=criticalgoes to a contact point holding Telegram and Slack. Something is broken and someone needs to look now.severity=warninggoes to Slack only, in a channel people read during working hours.- Everything else falls through to the default policy and lands in email, where it accumulates without interrupting anyone.
Four timing settings control how noisy this is, and each one does something specific:
group_bydecides what counts as the same notification. Grouping byalertnameand a service label means one cascading failure produces one message instead of forty.group_wait(default 30 seconds) is how long to hold the first notification for a new group, so related instances that fire a few seconds apart arrive together.group_interval(default 5 minutes) is the minimum gap before a group that has already notified sends again because new instances joined it.repeat_interval(default 4 hours) is how often an unresolved alert re-notifies with nothing new to say.
The temptation is to drop repeat_interval to fifteen minutes so nothing gets forgotten. Resist it. Teams that do this stop reading the channel within a month, which converts a routing problem into a much worse cultural one. Longer intervals plus a real escalation path beats short intervals every time.
Grafana also offers a simpler path: pick a contact point directly on the alert rule form and skip label matching entirely. Reasonable when a rule has one obvious destination. The trade-off is that routing knowledge moves into individual rules, so changing where a class of alerts goes means editing every rule instead of one policy.
Provision it as files, not clicks
Contact points built through the UI are invisible to review, easy to delete by accident, and impossible to recreate after a bad restore. If Grafana alert notifications matter enough to build, they matter enough to keep in Git. Grafana reads alerting configuration from files in the provisioning/alerting directory under its provisioning path at startup.
Before writing any YAML by hand, build one contact point in the UI, test it, then use the export option on the contact points list to dump it as YAML. That gives you the exact setting keys for that integration type instead of the ones you half-remember from a blog post. Setting names are not consistent between integration types, and a guessed key produces a config that loads without error and sends nothing.
apiVersion: 1

contactPoints:
  - orgId: 1
    name: critical-oncall
    receivers:
      # Telegram receiver goes here. Export it from the UI first:
      # the setting key names differ from what you would guess.
      - uid: critical-slack
        type: slack
        settings:
          url: https://hooks.slack.com/services/REPLACE/WITH/YOURS
        disableResolveMessage: false

  - orgId: 1
    name: warnings-slack
    receivers:
      - uid: warnings-slack
        type: slack
        settings:
          url: https://hooks.slack.com/services/REPLACE/WITH/YOURS

  - orgId: 1
    name: email-digest
    receivers:
      - uid: email-digest
        type: email
        settings:
          addresses: ops@example.com
          singleEmail: false
And the policy tree that uses them:
apiVersion: 1

policies:
  - orgId: 1
    receiver: email-digest
    group_by: [grafana_folder, alertname]
    group_wait: 30s
    group_interval: 5m
    repeat_interval: 4h
    routes:
      - receiver: critical-oncall
        matchers:
          - severity = critical
        group_wait: 10s
        repeat_interval: 1h
      - receiver: warnings-slack
        matchers:
          - severity = warning
        repeat_interval: 12h
Two things to know about provisioned resources. By default they become read-only in the UI, which is the point but surprises people the first time. And a contact point that a policy references cannot be deleted until the policy stops referencing it, so removals have to happen in the right order.
Keep tokens out of the files themselves. Grafana supports environment variable substitution in provisioning files, which means the YAML can live in Git and the secrets can come from your existing secret store.
Detecting the silence
Everything above still leaves the original problem unsolved. If the Slack app gets revoked or the SMTP password rotates, notifications stop and Grafana does not tell you.
The fix is a heartbeat alert, and it’s worth the twenty minutes. Create a rule whose condition is always true, give it a low severity label, route it to each contact point with a short repeat_interval, and point the resulting notification at an external dead-man’s-switch service. Healthchecks.io, Cronitor and Better Stack all offer this, and Healthchecks.io can be self-hosted if you’d rather not add a dependency. The service expects a signal on a schedule and alerts you when it stops arriving.
The logic is inverted on purpose. You aren’t monitoring infrastructure here, you’re monitoring the path that tells you about your infrastructure, and it has to be watched by something that isn’t itself.
As a second layer, Grafana exposes its own internal metrics on a Prometheus-compatible endpoint, including counters for notification attempts and failures. If you’re already scraping Grafana, alert on that failure counter increasing. It won’t catch a credential that works but delivers to a dead mailbox, which is why the heartbeat comes first.
Troubleshooting: the rule fires, nothing arrives
Work down this list in order. Each step rules out one hop, and stopping early is how people spend an afternoon on the wrong layer.
- Test the contact point in isolation. The Test button sends a notification without touching rules or policies. If it fails, the problem is credentials or network and nothing else matters yet.
- Watch the Grafana logs during the test. On a systemd install, run
journalctl -u grafana-server -fwhile you click Test. SMTP, Slack and Telegram delivery errors all surface here, usually specific enough to fix directly. - Compare the instance’s labels against your matchers. A policy matching
severity = criticalnever seesseverity = Critical. Matchers are exact and case-sensitive. Read the firing instance’s real labels, not the ones you think the rule sets. - Look for a policy earlier in the tree that swallowed it. Evaluation stops at the first match unless the policy continues. A broad route near the top silently absorbs everything below it.
- Check active silences and mute timings. A silence created during last month’s maintenance with a generous matcher is the classic. So is a mute timing in the wrong timezone.
- Check whether you’re inside
repeat_interval. A red alert now does not mean a notification is due now. This looks identical to a broken integration and isn’t. - For email, read the relay’s own logs. Grafana handing the message off is not delivery. Bounces and spam filing happen after Grafana’s involvement ends.
Common mistakes
- Configuring the email contact point and never touching
grafana.ini. The contact point is only a recipient list. Without the SMTP block, it has nothing to send with. - Routing by channel instead of severity. It feels tidy and it makes urgency impossible to express.
- Dropping the minus sign from a Telegram group chat ID. Group IDs are negative and the field takes the value literally.
- Sending verbose templates to Telegram. The 4096-character limit turns your biggest incident into your quietest one.
- Testing with the Test button and calling it done. Test bypasses the policy tree entirely. It proves the credential works, not that a real alert would ever reach it.
- Leaving resolved notifications on for every channel. Resolution messages in a pager channel double the volume and train people to ignore it.
- Storing webhook URLs and bot tokens in the UI only. They exist in one place, are invisible to review, and disappear with the database.
Best practices for Grafana alert notifications
- Set a consistent
severitylabel on every rule from day one. Retrofitting labels across dozens of rules is miserable work. - Use one contact point per urgency level, holding as many integrations as that level needs.
- Put a dashboard or runbook link in an annotation your templates render. An alert that says what broke but not where to look costs the responder five minutes every time.
- Write channel-specific templates: short for Telegram, richer for email, in between for Slack.
- Provision contact points and policies from files, with secrets injected from the environment, and run a heartbeat through every channel.
- Re-test every integration after credential rotation, Slack workspace changes or a Grafana upgrade. Those are the three events that quietly break delivery.
FAQ
Can one contact point send to email, Slack and Telegram at the same time?
Yes. A contact point holds multiple integrations and every one of them fires when that contact point is selected. This is the right way to build an escalation tier: one contact point per severity, with the channel mix chosen to match how urgently that severity needs attention.
Why does the Test button work but real alerts never arrive?
Test sends straight to the contact point and skips the policy tree. If it works and real alerts don’t, the break is in routing: matchers that don’t match, a broader policy earlier in the tree absorbing the alert, an active silence, or a mute timing. Open the firing instance, read its real labels, and compare them character by character against your matchers.
Do I need Grafana Cloud for any of this?
No. Contact points, notification policies, templates and all three integrations ship in the open source build. Grafana Cloud handles hosting and adds on-call tooling on top, which matters if you need rotations and escalation chains. For a team routing alerts to three channels, a self-hosted instance on a modest VPS does everything described here.
Should I use a Slack webhook or a bot token?
Webhook for one or two channels where speed of setup matters. Bot token once you have several channels, want one revocable credential, or need to see in one place what the integration is allowed to do. Both deliver identically; the difference is entirely in credential management.
Why did my Telegram alerts stop during a big outage?
Almost certainly the 4096-character limit. A large grouped notification exceeded it, truncation broke the message markup, and Telegram rejected the send outright. Shorten the template for that channel, group more narrowly, or drop the parse mode. It’s the failure mode most worth guarding against, because it only shows up when you need the channel most.
Can I keep using the Prometheus Alertmanager I already run?
Yes. Grafana can send to an external Alertmanager instead of its built-in one, and the contact point selector at the top of the alerting pages lets you choose which one you’re configuring. If you already have a mature Alertmanager routing config, keeping it and pointing Grafana at it is usually less work than migrating the tree.
The one thing to remember
A firing rule proves evaluation works. It proves nothing about whether anyone was told. Grafana alert notifications cross three or four systems after the rule turns red, and every one of them fails quietly by default.
So build the channels carefully, route by severity rather than by tool, then run a heartbeat through every path and let something outside Grafana watch it. The alternative is finding out during the incident, which is the one time you have no attention to spare.
Need alerting that reaches people?
Most of the Grafana setups I get asked to look at have good dashboards and alerting nobody trusts. Work I take on here:
- Fixing email delivery end to end: SMTP config, relay selection, SPF, DKIM and DMARC so alerts stop landing in spam.
- Setting up Slack and Telegram contact points properly, including bot apps, scoped tokens and channel-appropriate templates.
- Designing a policy tree around severity labels, with grouping and timing tuned so people keep reading the channel.
- Converting click-built alerting into provisioned YAML under version control, with secrets kept out of Git.
- Adding heartbeat monitoring so a broken notification path announces itself instead of waiting for an outage.
- Auditing alert rules for missing labels, missing runbook links, and rules that fire constantly and are therefore ignored.
Send me your notification policy export and the output of journalctl -u grafana-server from a period when an alert should have gone out, and I’ll tell you which hop is dropping it.