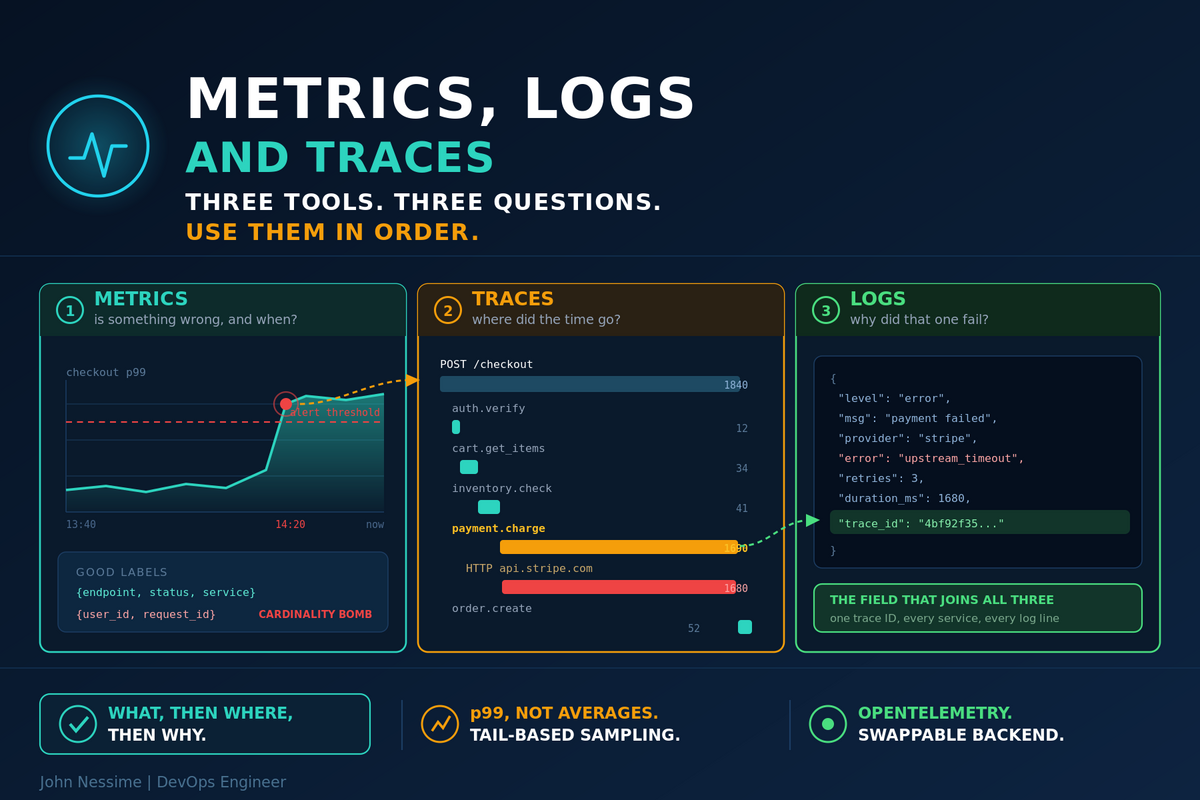
Grafana Alert Notifications That Actually Arrive: Email, Slack and Telegram

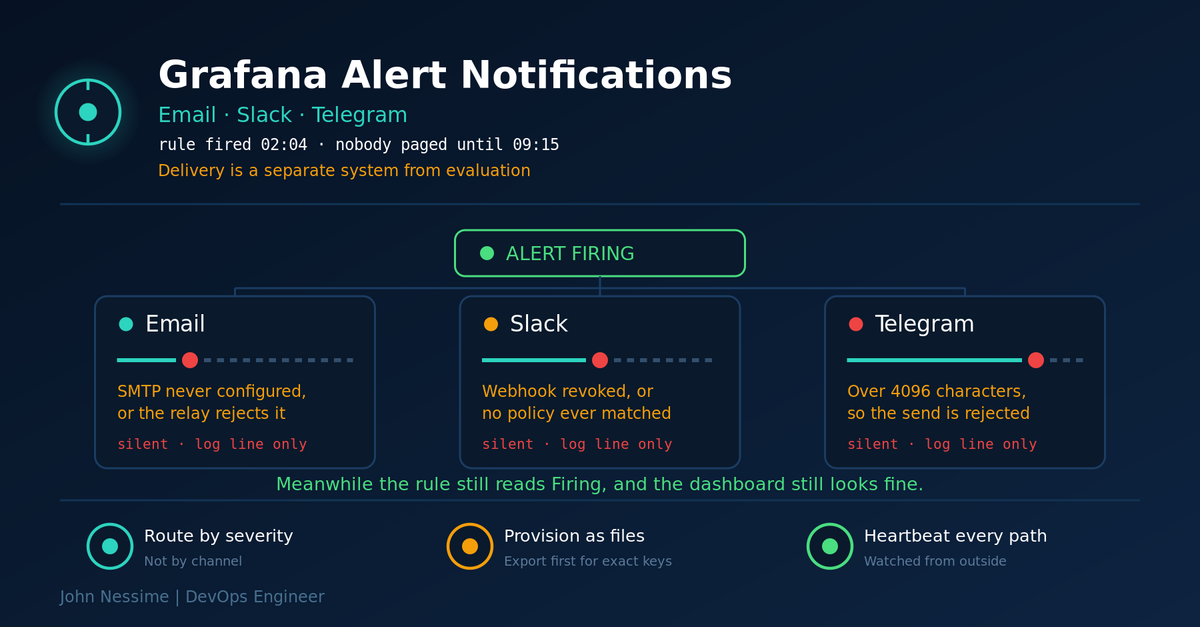
The rule went red at 02:04 and nobody found out until 09:15. Rule evaluation and notification delivery are two different systems, and only one of them is visible in the UI. A practical setup for Grafana alert notifications to email, Slack and Telegram, plus how to detect the day delivery quietly stops.

Continue ReadingGrafana Alert Notifications That Actually Arrive: Email, Slack and Telegram

Monitoring n8n Workflow Failures in Grafana: Why Your Green Dashboard Is Lying

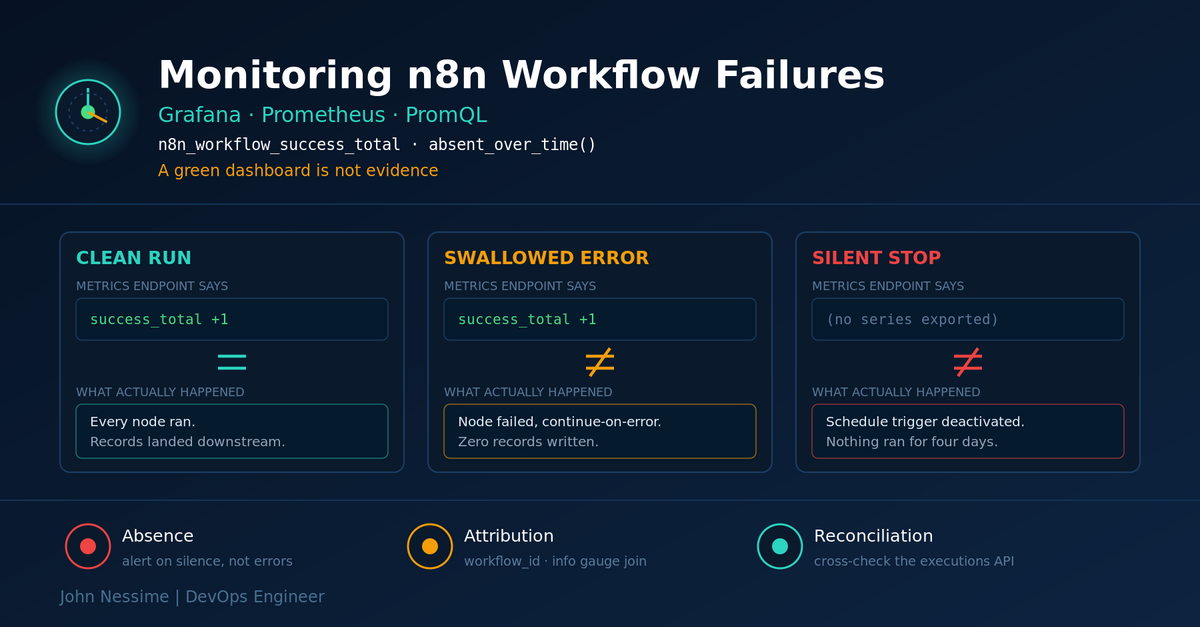
n8n's Prometheus endpoint tells you the process is alive and busy. It does not tell you a workflow stopped producing correct output. This post walks through the three failure families that slip past a default n8n dashboard, the PromQL that catches each one, and how to close the gap with a second source of truth from the executions API.

Continue ReadingMonitoring n8n Workflow Failures in Grafana: Why Your Green Dashboard Is Lying

Troubleshooting High I/O Wait Without Blaming the Disk

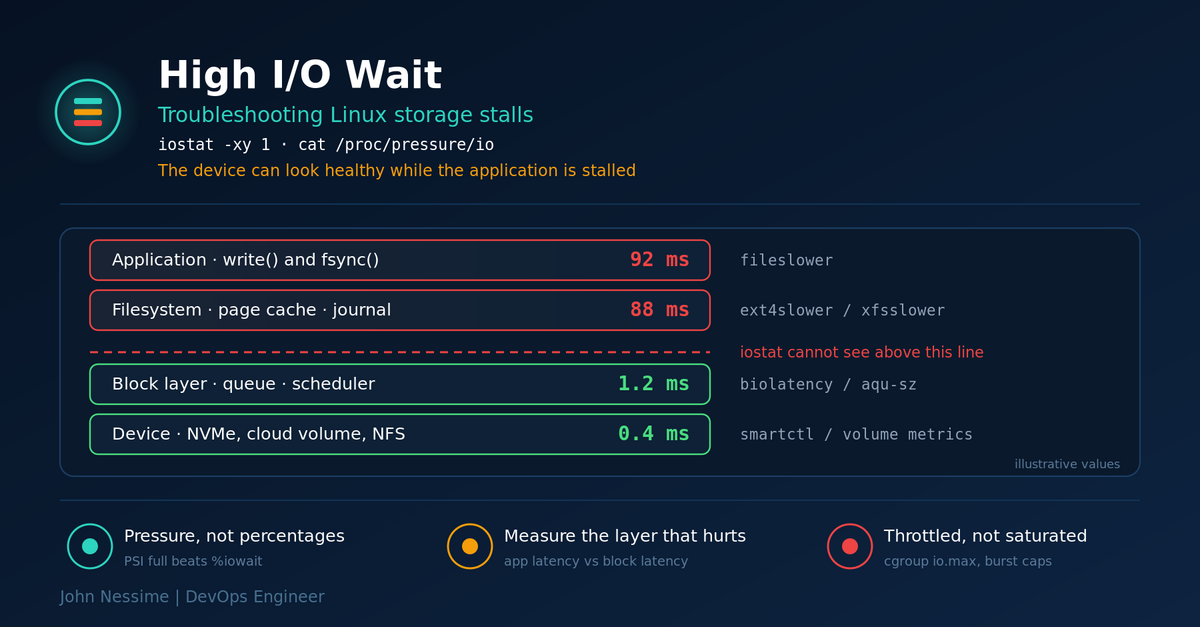
High I/O wait is a symptom, not a diagnosis. It rises when nothing is wrong and stays flat when something is badly wrong, and it only sees one layer of the storage stack. This is how to read iowait and PSI correctly, then work through the five failure families that actually produce storage stalls: device saturation, memory pressure, synchronous writes, throttling, and latency that lives above the block layer entirely.

Continue ReadingTroubleshooting High I/O Wait Without Blaming the Disk

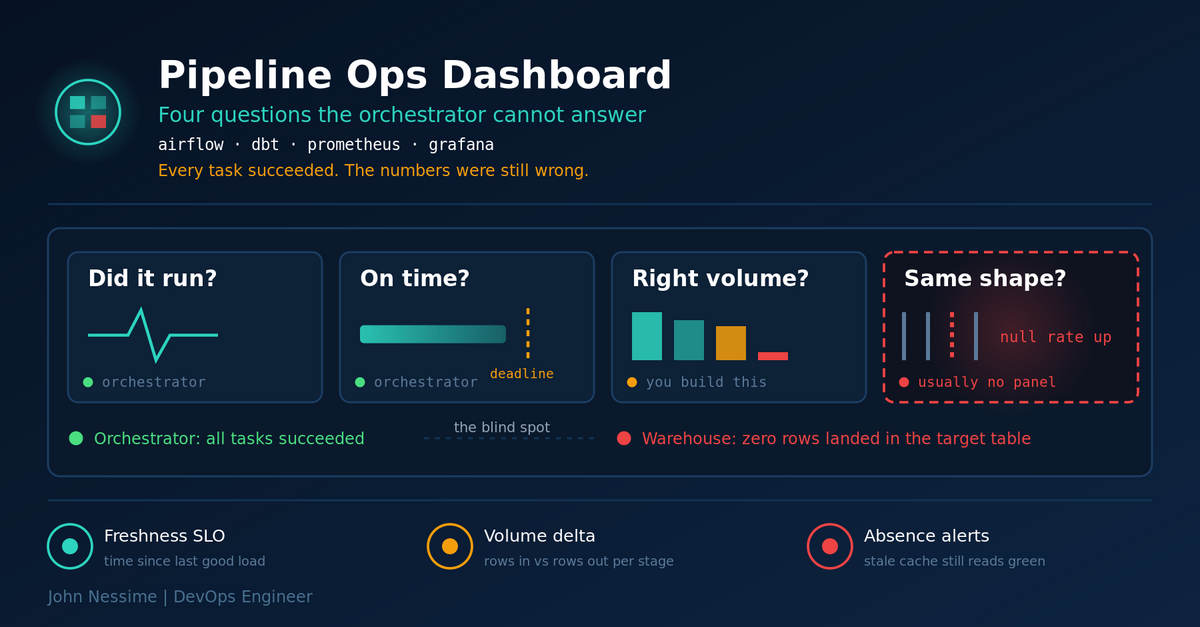
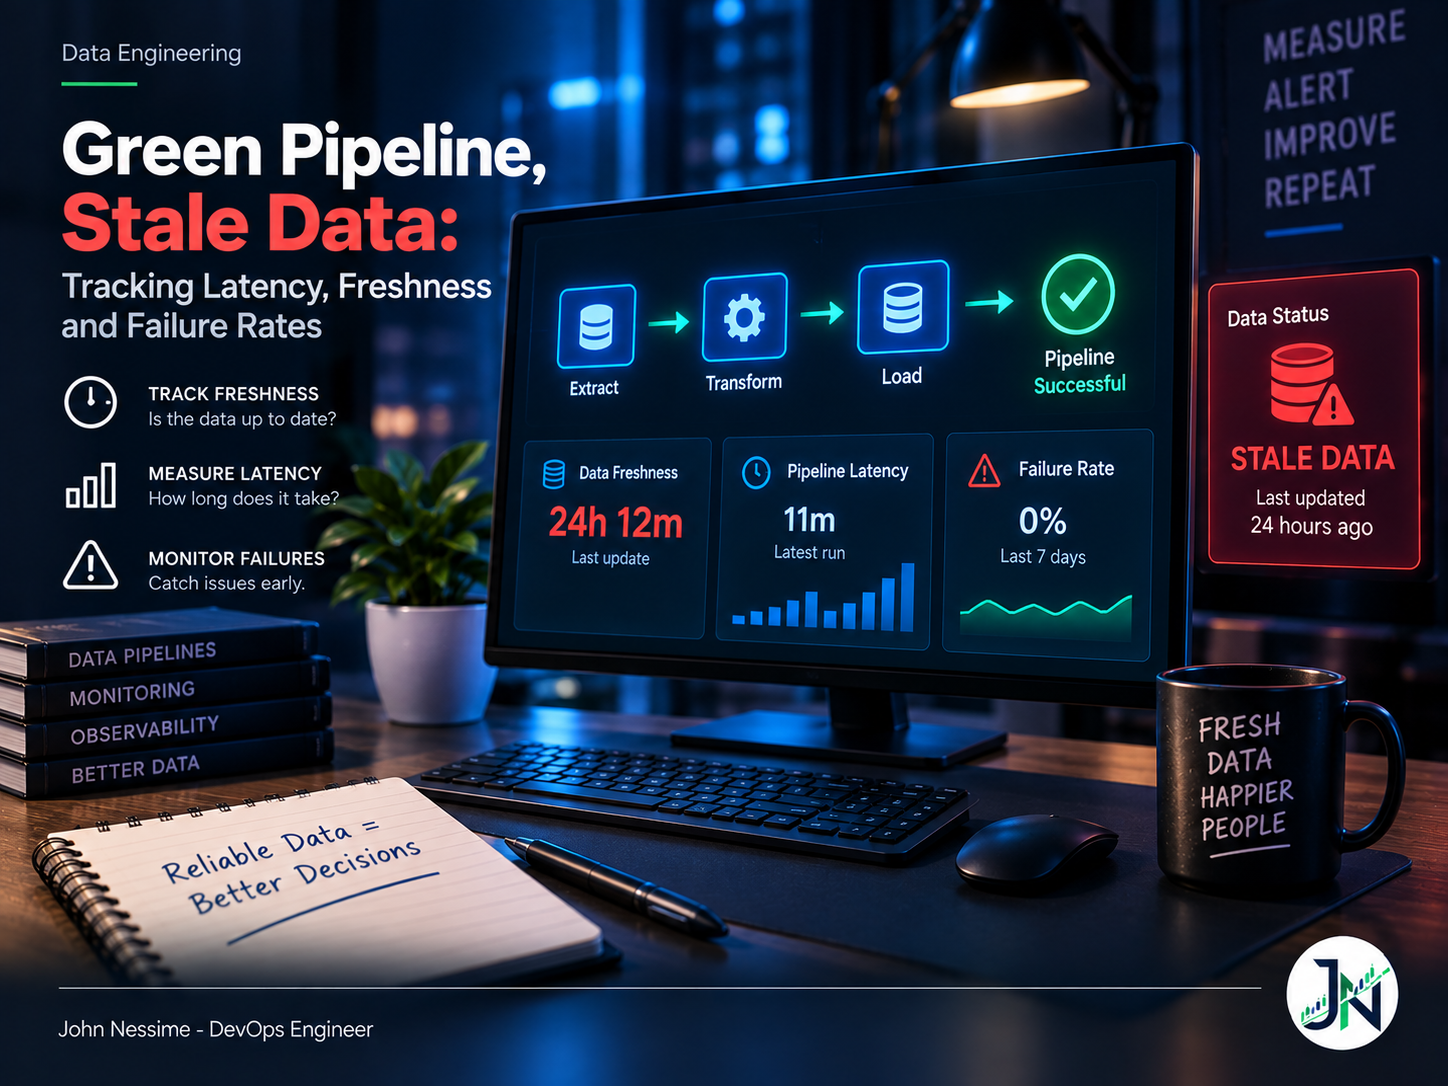
Grafana Monitoring for AWS Data Pipelines: The Green Dashboard Problem

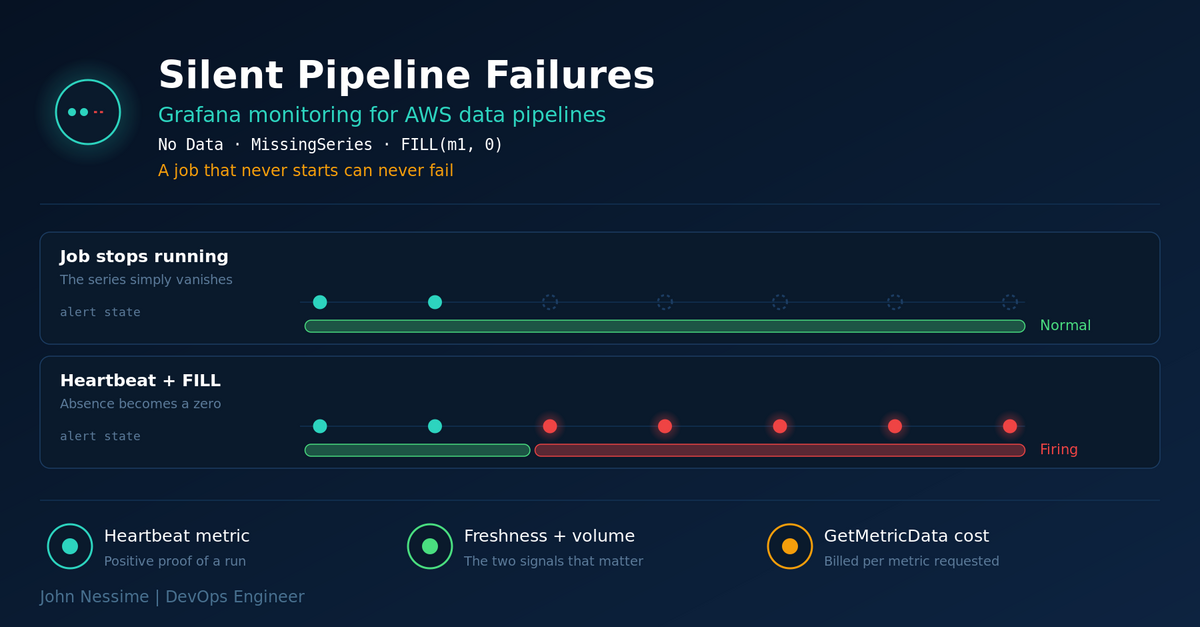
A Glue job that stops running emits no metrics, so the dashboard stays green and the alert quietly resolves itself. Here is why Grafana monitoring for AWS data pipelines misses that failure, and the heartbeat, metric math and no-data configuration that closes the gap, along with the CloudWatch query costs and IAM boundaries nobody warns you about.

Continue ReadingGrafana Monitoring for AWS Data Pipelines: The Green Dashboard Problem

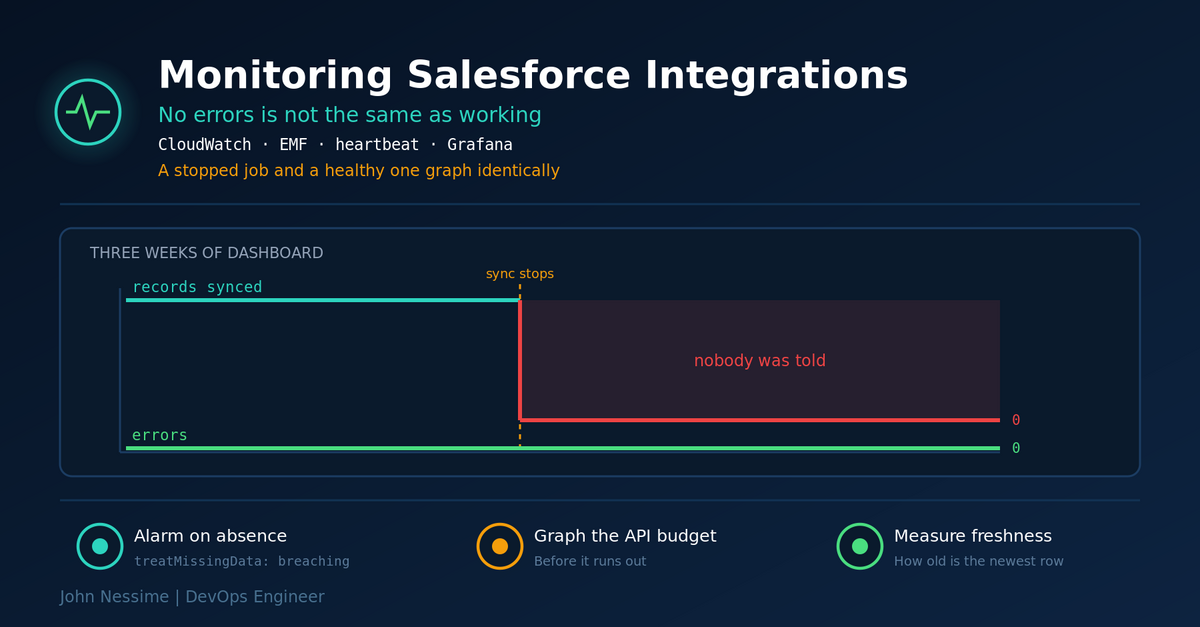
Zero Errors, Zero Records: Monitoring Salesforce Integrations with CloudWatch and Grafana

The error count was zero every day for three weeks. So was the invocation count. A stopped integration and a healthy one produce identical graphs, and every CloudWatch default is tuned to stay quiet when data stops arriving. Four signals worth emitting, and the alarm config that actually fires.

Continue ReadingZero Errors, Zero Records: Monitoring Salesforce Integrations with CloudWatch and Grafana