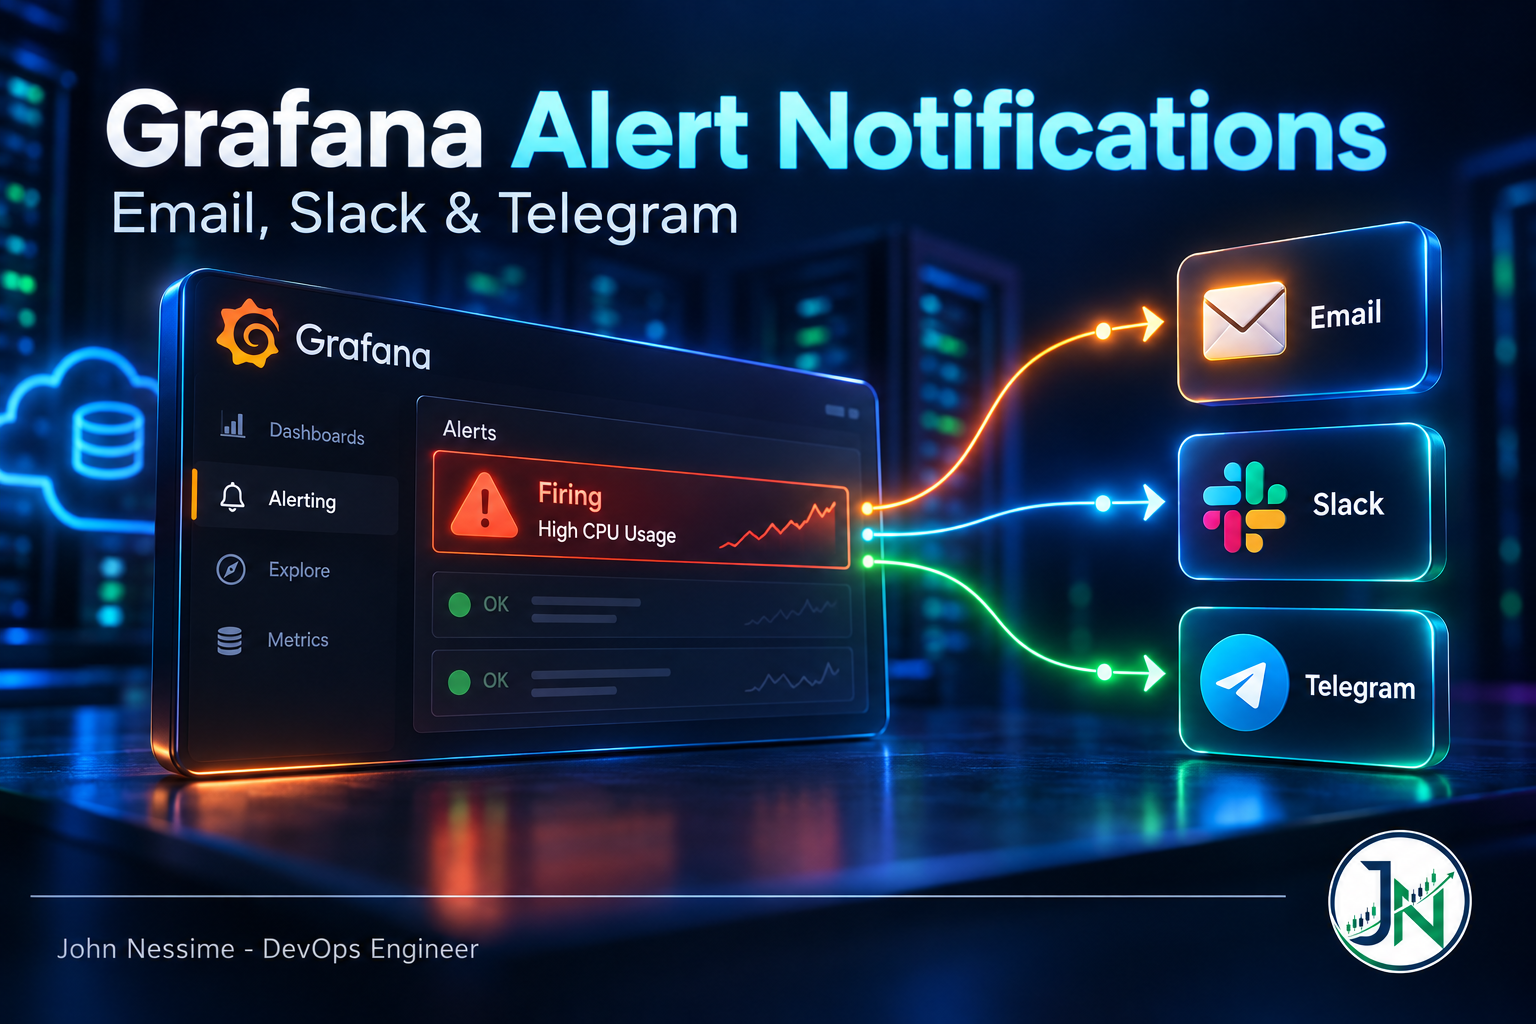
Grafana Alert Notifications That Actually Arrive: Email, Slack and Telegram

The rule went red at 02:04 and nobody found out until 09:15. Rule evaluation and notification delivery are two different systems, and only one of them is visible in the UI. A practical setup for Grafana alert notifications to email, Slack and Telegram, plus how to detect the day delivery quietly stops.
Continue ReadingGrafana Alert Notifications That Actually Arrive: Email, Slack and Telegram

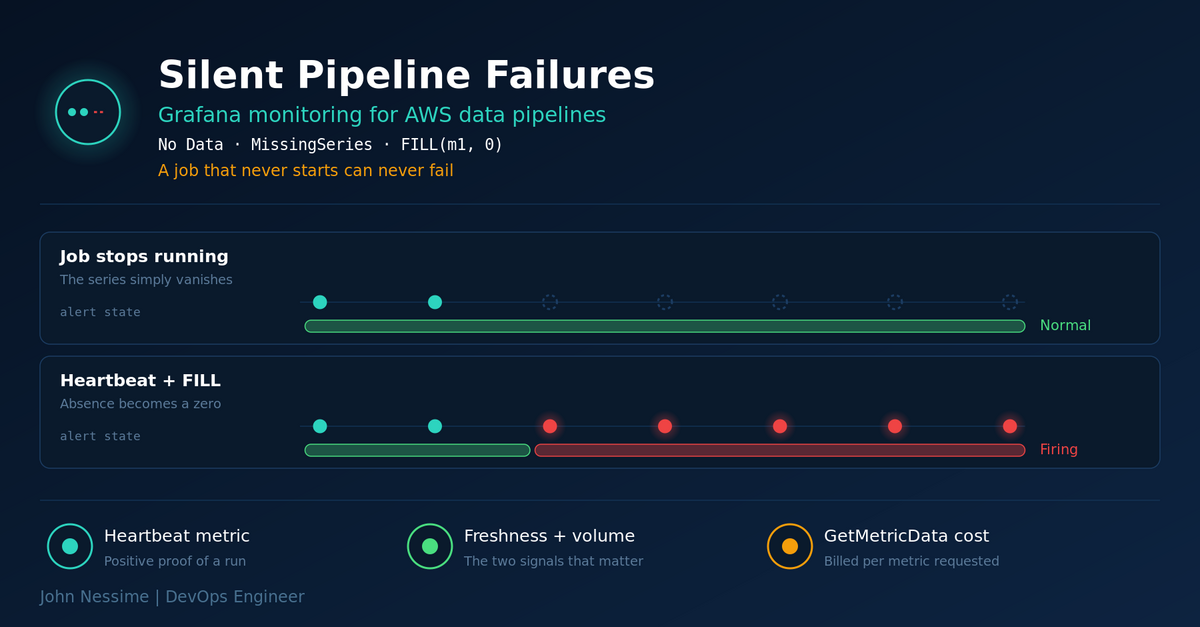
Grafana Monitoring for AWS Data Pipelines: The Green Dashboard Problem

A Glue job that stops running emits no metrics, so the dashboard stays green and the alert quietly resolves itself. Here is why Grafana monitoring for AWS data pipelines misses that failure, and the heartbeat, metric math and no-data configuration that closes the gap, along with the CloudWatch query costs and IAM boundaries nobody warns you about.

Continue ReadingGrafana Monitoring for AWS Data Pipelines: The Green Dashboard Problem