Skip to content
John Nessime
Search this website

Prometheus

  1. Home>
  2. Prometheus
Read more about the article Metrics, Logs and Traces: What Each One Answers

Metrics, Logs and Traces: What Each One Answers

  • Post category:DevOps/System Administration/Web Performance

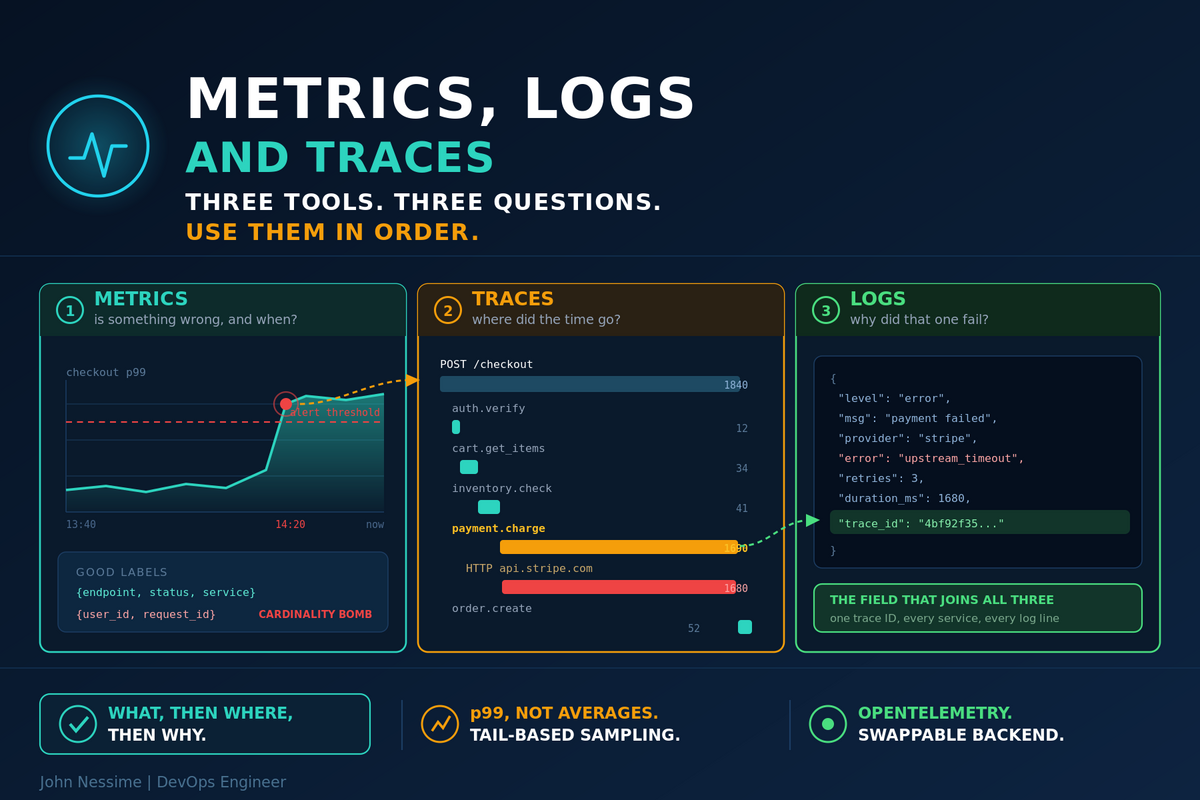
Metrics tell you that something is wrong. Traces tell you where. Logs tell you why. Use them in that order and each step narrows the search — start with logs and you are grepping a firehose. Here is what each one is actually for, and the field that connects all three.

Continue ReadingMetrics, Logs and Traces: What Each One Answers
Read more about the article Prometheus + Grafana From Scratch on One Server

Prometheus + Grafana From Scratch on One Server

  • Post category:DevOps/Linux/System Administration

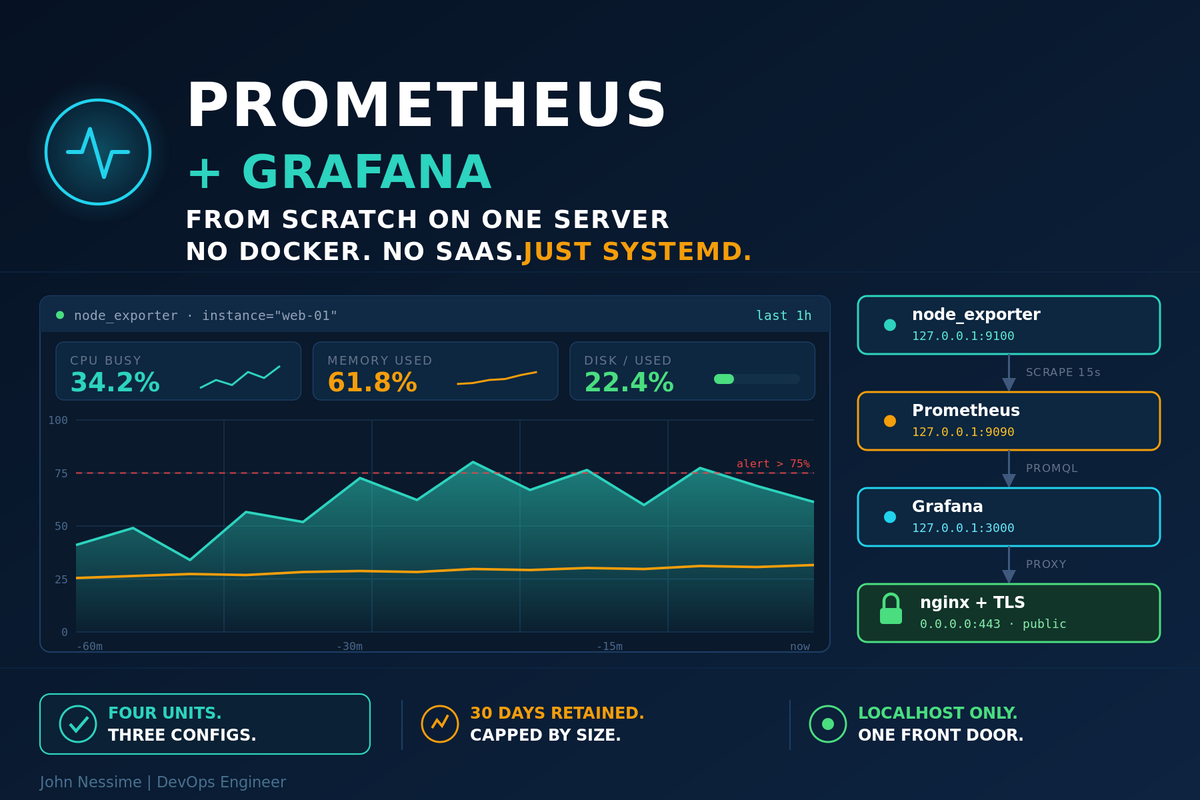
Two static binaries, a package and four systemd units. How to install Prometheus and Grafana on a single server from scratch, wire in node_exporter, put nginx and TLS in front, and keep the ports that have no authentication off the public internet.

Continue ReadingPrometheus + Grafana From Scratch on One Server
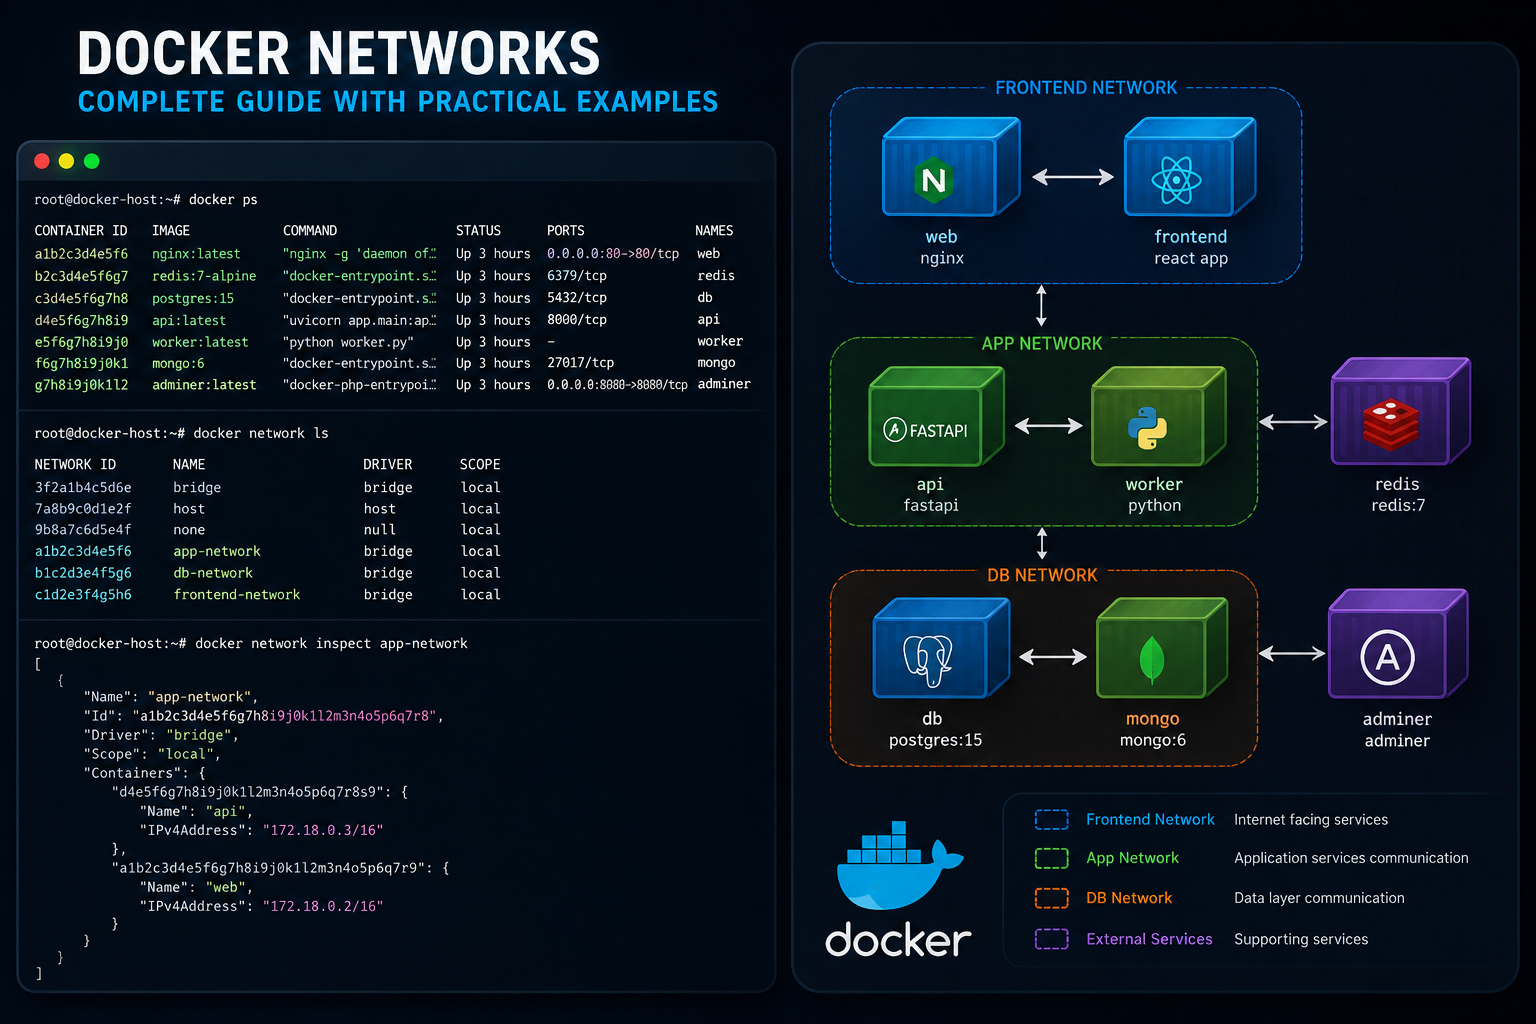
Read more about the article Docker Issues & Troubleshooting: Real-World Solutions

Docker Issues & Troubleshooting: Real-World Solutions

  • Post category:Articles/Cloud Computing/DevOps/Docker/Linux/Tutorials

Docker containers rarely fail without leaving clues. This practical guide explores common Docker issues involving networking, storage, permissions, ports, logs, health checks, reverse proxies, and resource usage—and explains how to troubleshoot them methodically.

Continue ReadingDocker Issues & Troubleshooting: Real-World Solutions

Recent Posts

  • Green Check, Broken Build: How to Build a Fail Fast Pipeline That Explains Why
  • Metrics, Logs and Traces: What Each One Answers
  • CDN Setup Without Breaking Dynamic Content
  • Cleaning Up Docker Disk Usage Safely
  • A Secure-by-Default AWS Account Baseline in Terraform

Recent Comments

No comments to show.
© 2025 · John Nessime · Cairo, Egypt · All rights reserved