Grafana Alert Notifications That Actually Arrive: Email, Slack and Telegram

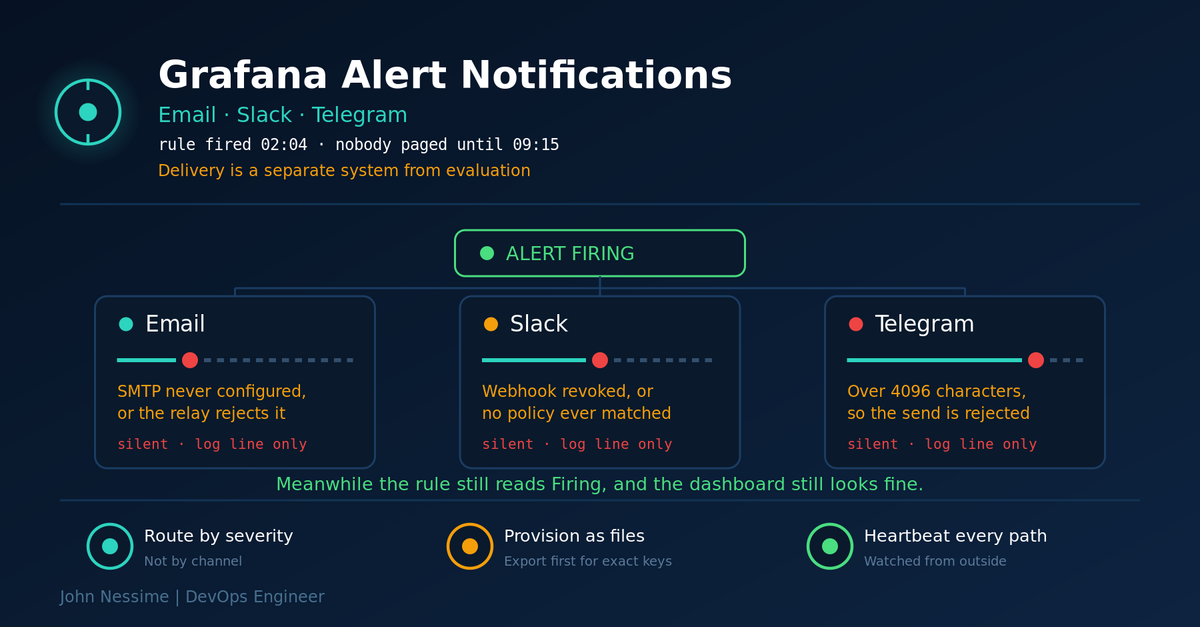
The rule went red at 02:04 and nobody found out until 09:15. Rule evaluation and notification delivery are two different systems, and only one of them is visible in the UI. A practical setup for Grafana alert notifications to email, Slack and Telegram, plus how to detect the day delivery quietly stops.
Continue ReadingGrafana Alert Notifications That Actually Arrive: Email, Slack and Telegram

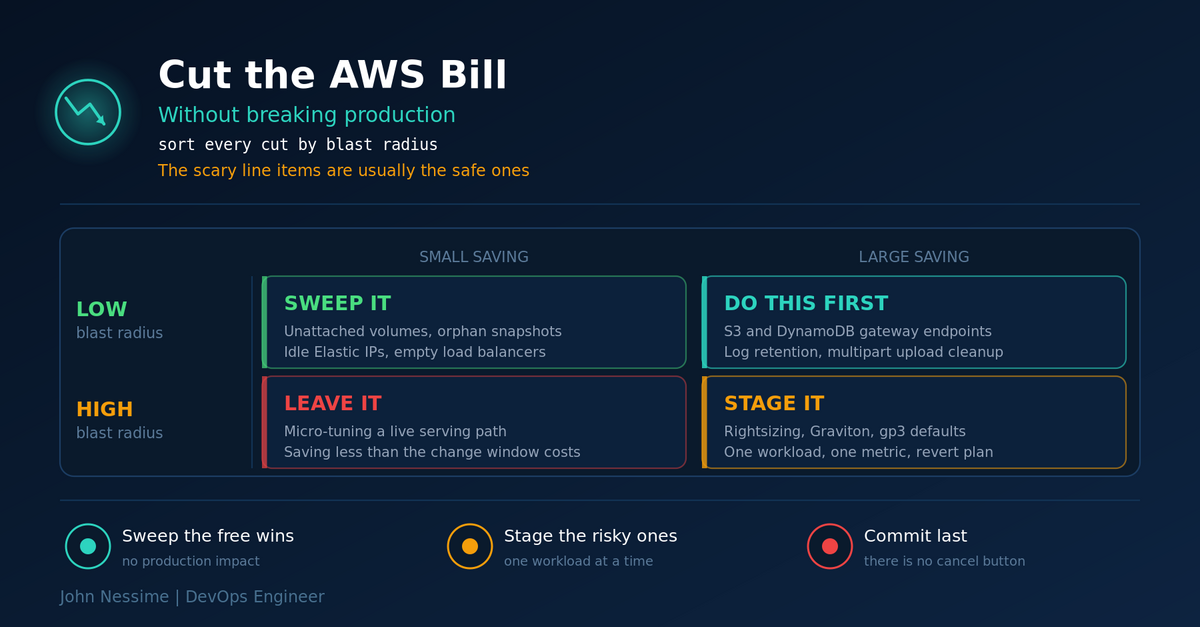
Cut AWS Costs Without Breaking Production: A Blast-Radius Playbook

Most AWS cost work goes wrong because it starts with the biggest line item, which is also the riskiest. Order the work by blast radius instead: free networking and storage fixes first, performance envelopes one workload at a time, and commitments last. Includes the commands to find the waste and the cuts that look harmless and are not.

Continue ReadingCut AWS Costs Without Breaking Production: A Blast-Radius Playbook

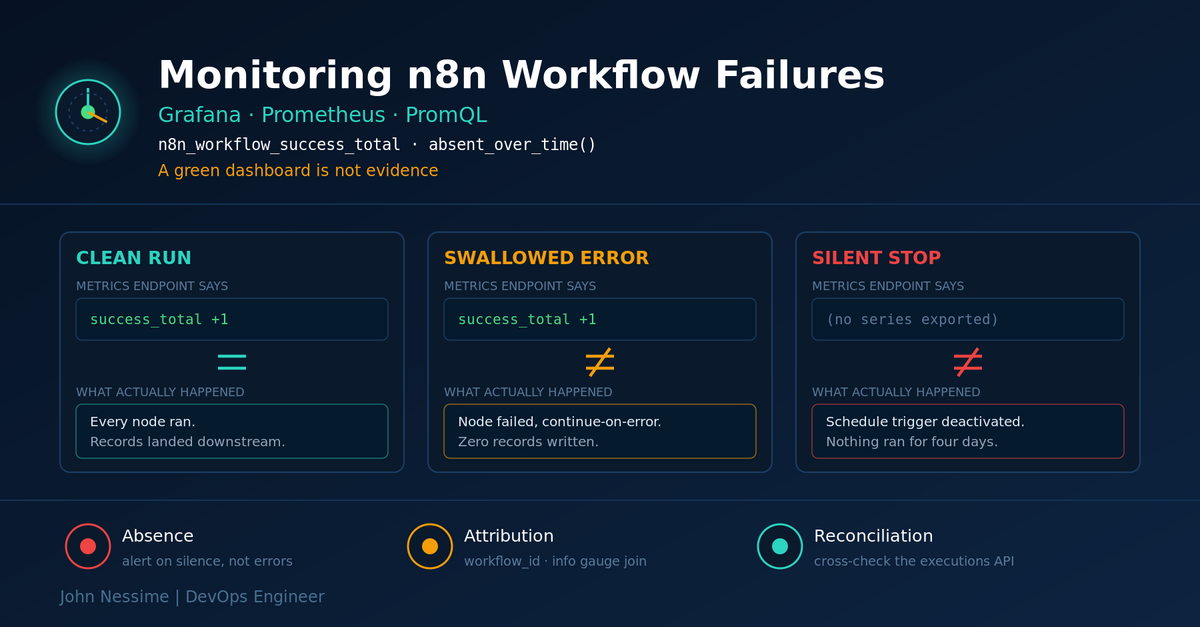
Monitoring n8n Workflow Failures in Grafana: Why Your Green Dashboard Is Lying

n8n's Prometheus endpoint tells you the process is alive and busy. It does not tell you a workflow stopped producing correct output. This post walks through the three failure families that slip past a default n8n dashboard, the PromQL that catches each one, and how to close the gap with a second source of truth from the executions API.

Continue ReadingMonitoring n8n Workflow Failures in Grafana: Why Your Green Dashboard Is Lying

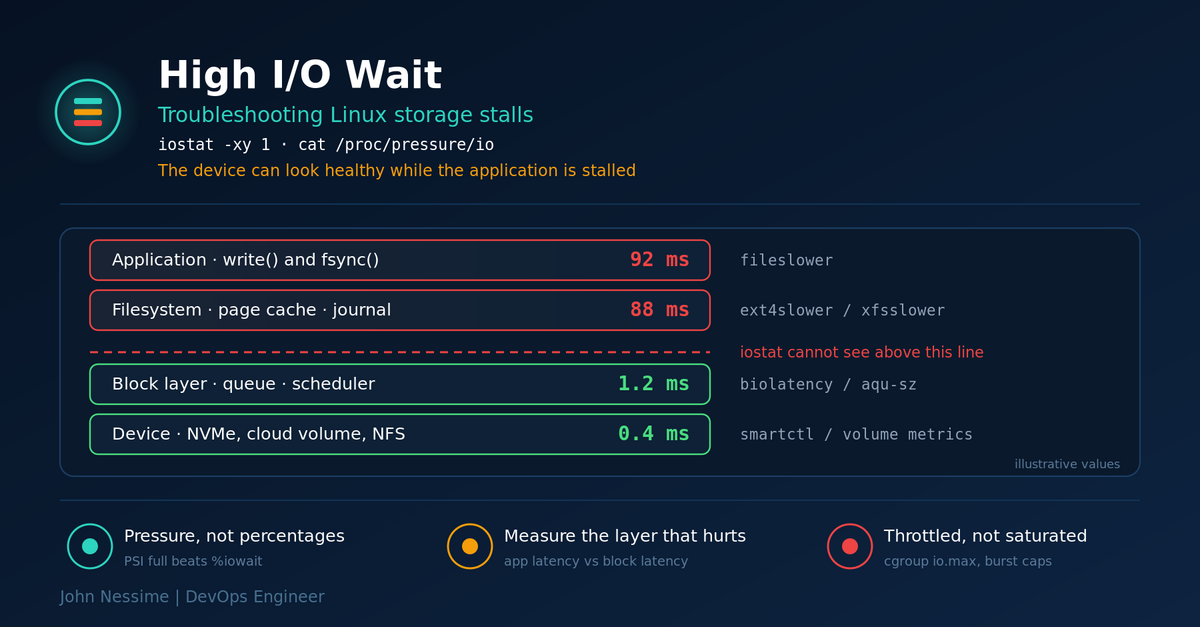
Troubleshooting High I/O Wait Without Blaming the Disk

High I/O wait is a symptom, not a diagnosis. It rises when nothing is wrong and stays flat when something is badly wrong, and it only sees one layer of the storage stack. This is how to read iowait and PSI correctly, then work through the five failure families that actually produce storage stalls: device saturation, memory pressure, synchronous writes, throttling, and latency that lives above the block layer entirely.

Continue ReadingTroubleshooting High I/O Wait Without Blaming the Disk

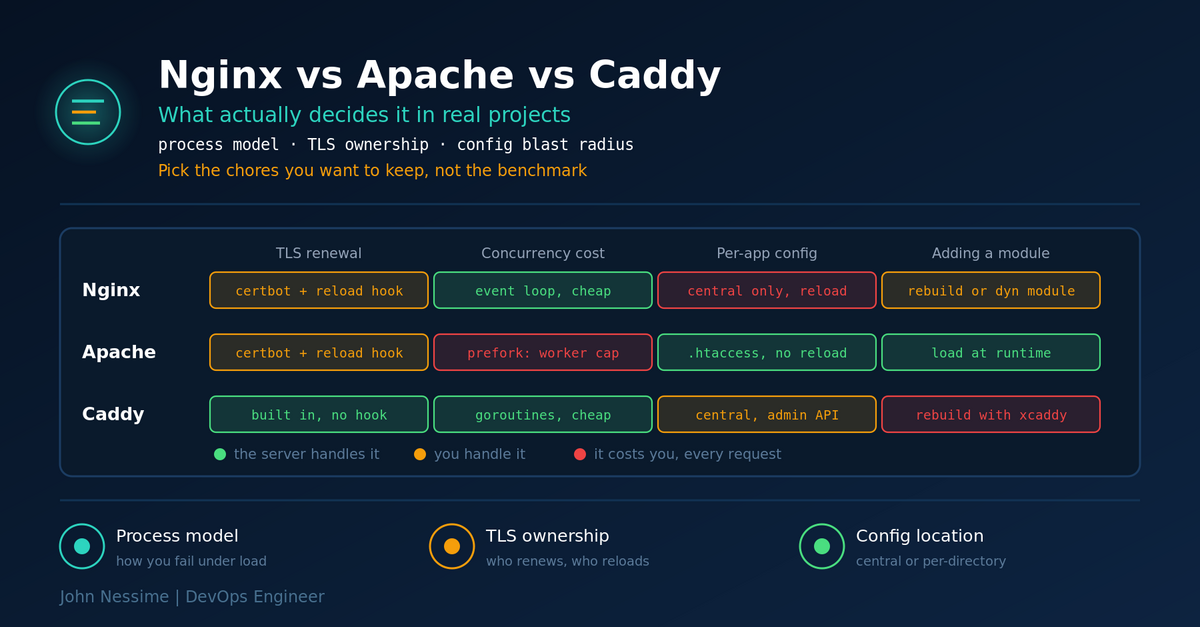
Nginx vs Apache vs Caddy: What Actually Decides It in Real Projects

Benchmarks pick the wrong winner. Here is how Nginx, Apache and Caddy actually differ in production: how each one fails under load, who owns certificate renewal, and where configuration lives when a developer needs to change it. Includes a decision procedure and the mistakes I see most.

Continue ReadingNginx vs Apache vs Caddy: What Actually Decides It in Real Projects

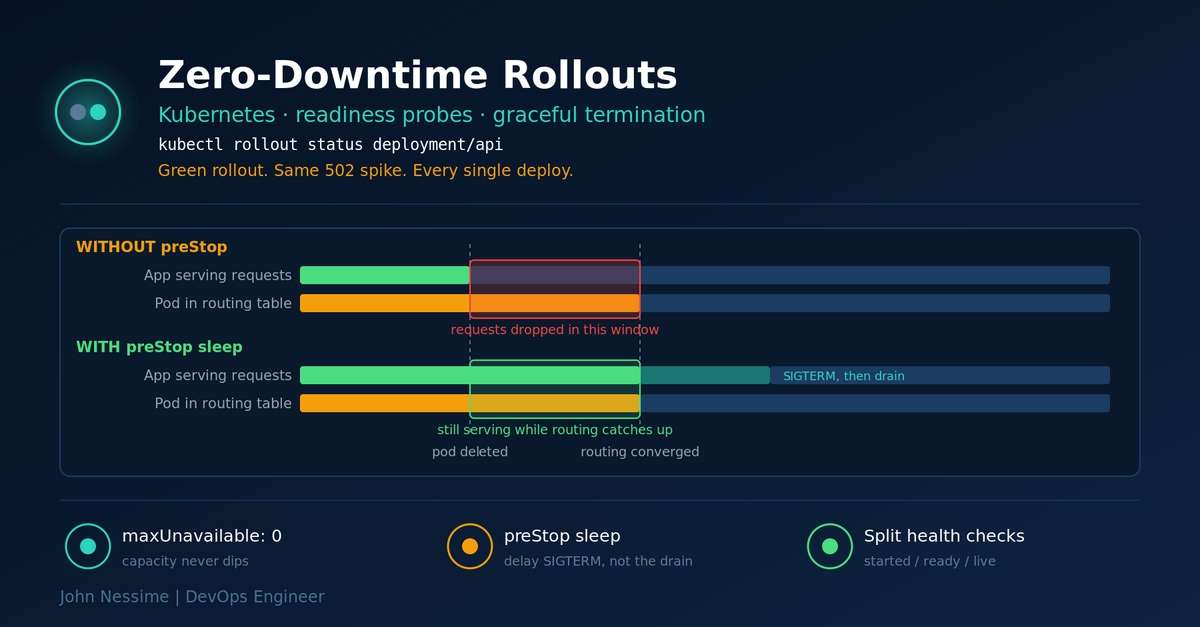
Kubernetes Zero-Downtime Rollouts: Why Your Readiness Probe Isn’t Saving You

Readiness probes are necessary for Kubernetes zero-downtime rollouts, but they only close one of four gaps. Here is what actually drops requests during a deploy: the race between SIGTERM and endpoint propagation, probes that lie, surge settings that quietly delete capacity, and load balancers that never watched EndpointSlices in the first place.

Continue ReadingKubernetes Zero-Downtime Rollouts: Why Your Readiness Probe Isn’t Saving You

Docker Logs Ate My Disk: A Working Guide to Log Drivers and Rotation

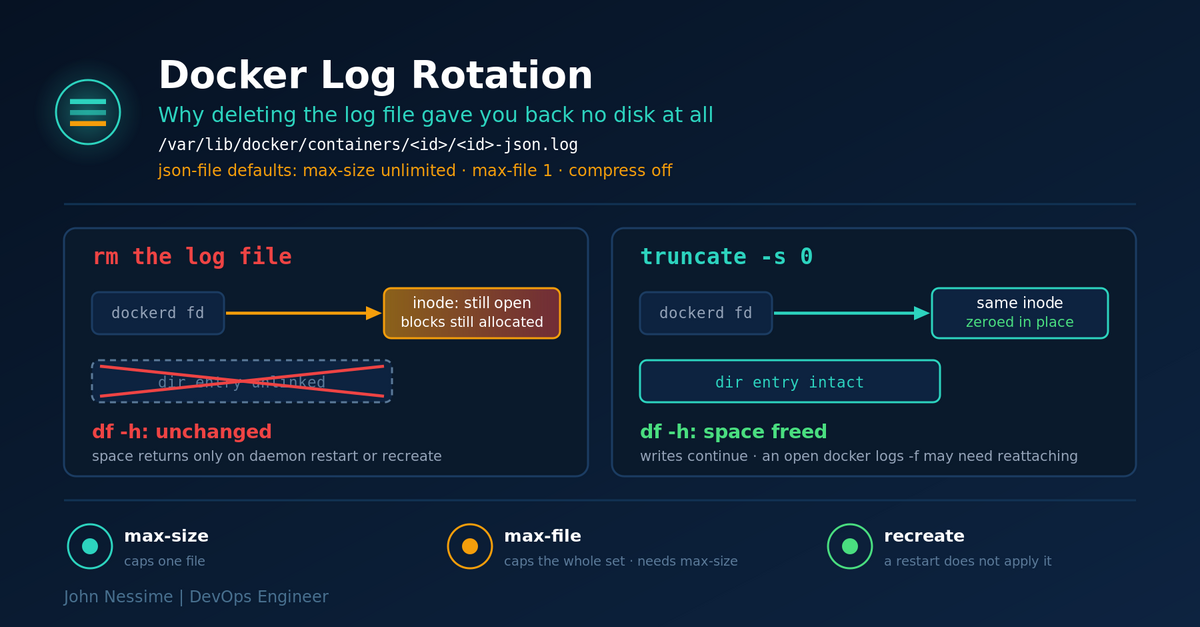
Docker's default logging driver writes container output to a JSON file with no size limit and no rotation. This is a practical guide to Docker log rotation: what the defaults actually do, why your daemon.json change did nothing, why deleting the log file did not free any disk, and how to choose between json-file, local, journald and shipping logs off the box.

Continue ReadingDocker Logs Ate My Disk: A Working Guide to Log Drivers and Rotation

Podman vs Docker: Is the Switch Actually Worth It?

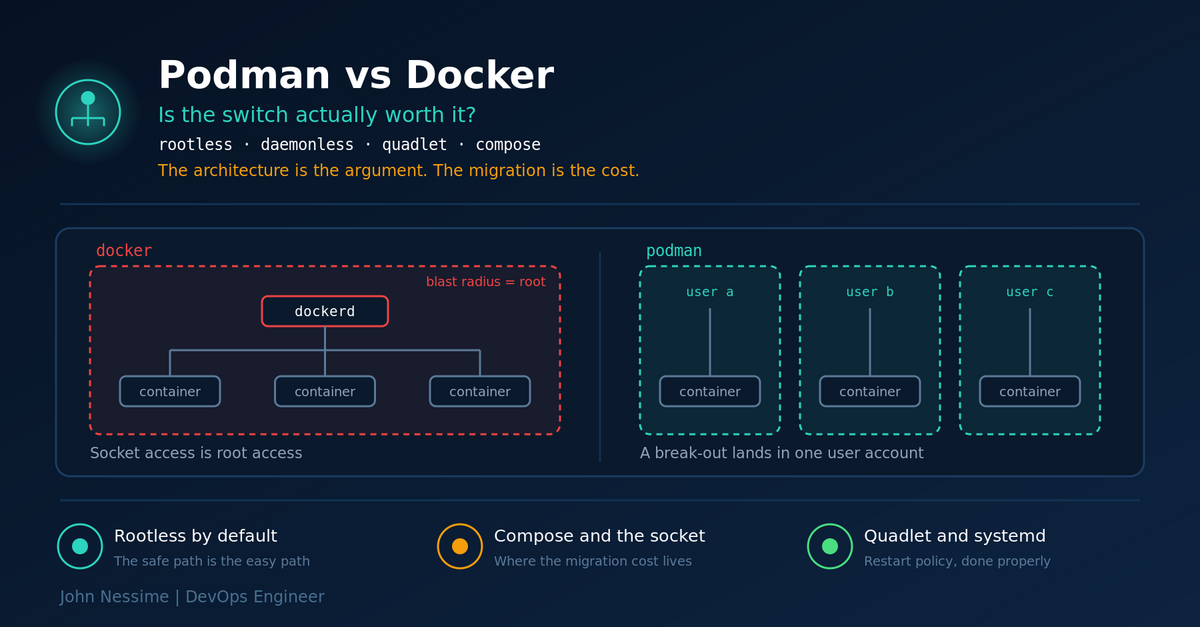
Podman is the better-designed container engine and Docker is the better-supported one. A working engineer's comparison: the architectural difference that drives everything, where each one wins and loses, the four things that genuinely break in a migration (compose, the Docker socket, privileged ports, restart on boot), and a decision procedure to run against your own setup.

Continue ReadingPodman vs Docker: Is the Switch Actually Worth It?