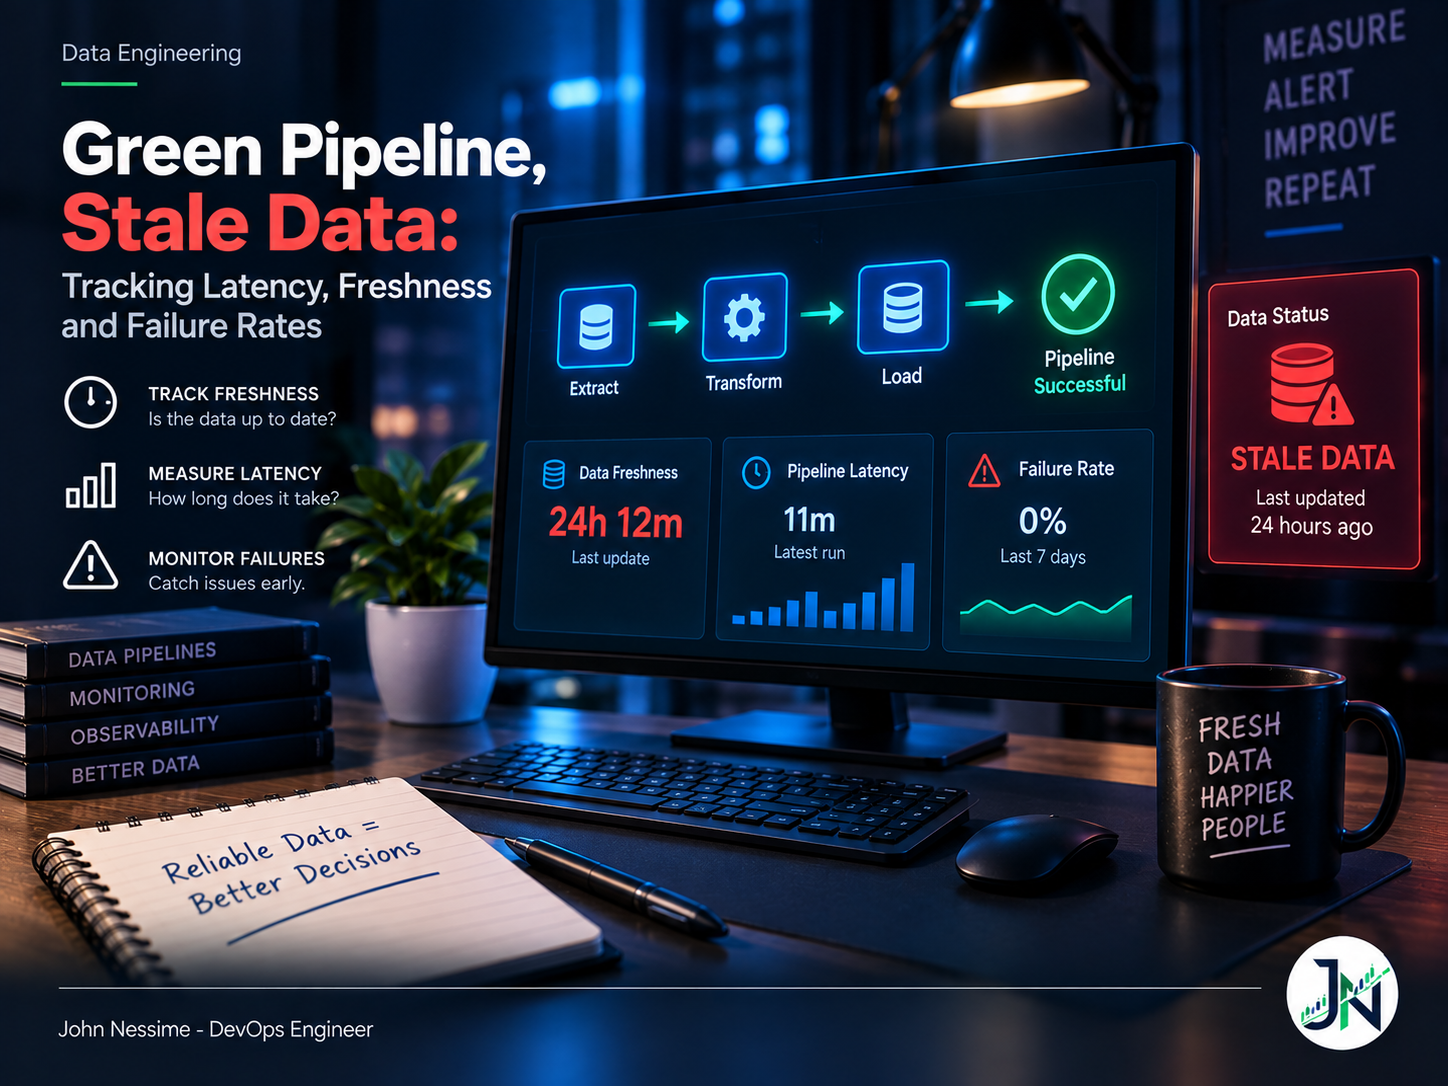
The message lands at 8:40 in the morning. “Are the revenue numbers right? They look like yesterday’s.” You open the orchestrator and every task is green. The run finished in eleven minutes, comfortably inside its window. Zero errors. Zero retries. The pipeline did exactly what it was told to do, and the number on the dashboard is a day old.
That gap is the entire problem. Run status tells you the code executed. It tells you nothing about whether data arrived. Data pipeline freshness monitoring is the signal that closes the gap, and most teams add it only after an analyst finds the stale table first.
This post covers the three signals worth instrumenting for a batch or streaming pipeline: how current the data is, how long it took to get there, and how often the thing breaks. For each one I’ll cover what to measure, where to measure it, the queries and config that produce it, and the specific ways the measurement lies to you.
The signal that lies to you first: run status
Job success is a statement about your code path, not about your data. A pipeline that reads an empty S3 prefix, transforms zero rows, writes zero rows and exits cleanly has succeeded. So has one whose upstream API silently started returning an empty page after a token rotation. So has one whose incremental watermark got stuck and now re-reads the same already-loaded slice on every run.
All three are green. All three are producing stale data. This is why the ordering matters: freshness is the signal that fires first in a real incident, and run status is usually the last one to notice anything at all.
So keep run status. It’s cheap and it catches crashes. Just stop treating it as your top-line health indicator.
Freshness: measure the table, not the job
Freshness is the age of the newest record in a dataset. It’s measured against the dataset itself, not against the process that filled it, and that distinction is what makes it useful. If your job disappears entirely, freshness keeps climbing and keeps alerting. If your job succeeds while doing nothing, freshness keeps climbing and keeps alerting. It’s the one signal that survives both failure modes.
Two clocks, and you need both
Every row usually carries two timestamps: when the event happened in the source system, and when your pipeline wrote it. Track the maximum of each.
- Max event time tells you whether the upstream system is still producing. If this stops moving, the problem is upstream of you.
- Max load time tells you whether your pipeline is still writing. If this stops moving while event time is fine, the problem is yours.
Watching only one of them means every stale-data page starts with twenty minutes of figuring out which side of the boundary the fault sits on. Watching both answers that in the alert body.
A freshness probe is a small scheduled query. This one is PostgreSQL syntax, and it returns both clocks plus a volume check in a single round trip:
select
  'orders' as dataset,
  extract(epoch from max(event_ts))  as max_event_ts,
  extract(epoch from max(loaded_at)) as max_loaded_at,
  count(*) filter (where loaded_at >= now() - interval '1 hour') as rows_last_hour
from analytics.orders;
The row count matters. A pipeline can advance its load timestamp while writing almost nothing, which is what a partially broken source looks like. Freshness alone will not catch that; freshness plus volume will.
Run that probe on a schedule that’s independent of the pipeline, push the results as gauges, and alert on age in PromQL:
# Newest row is older than 90 minutes
time() - max by (dataset) (dataset_max_loaded_timestamp_seconds) > 5400

# The probe itself has stopped reporting: a deadman check
absent(dataset_max_loaded_timestamp_seconds{dataset="orders"})
That second rule is the one people forget. A freshness metric that disappears looks identical to a healthy silence on a graph. absent() is what turns “no data” into a page.
Where dbt fits
If you’re already running dbt, source freshness is built in and worth using before you write anything custom. You declare thresholds per source, and dbt queries the maximum of your timestamp column and compares it to now.
sources:
  - name: raw_shop
    schema: raw
    config:
      loaded_at_field: _loaded_at
      freshness:
        warn_after: {count: 2, period: hour}
        error_after: {count: 6, period: hour}
    tables:
      - name: orders
      - name: refunds
        config:
          freshness:
            warn_after: {count: 12, period: hour}
            error_after: {count: 24, period: hour}
Three details that trip people up. First, dbt source freshness is a separate command; dbt build does not run it, so a green build says nothing about source staleness. Second, it exits non-zero when a source hits its error_after threshold, which makes it a natural gate at the top of a job: fail fast rather than building models on stale input. Third, results land in target/sources.json, which is the artifact you parse if you want to distinguish warn from error, or ship the numbers into Prometheus rather than just failing the run.
dbt source freshness --select source:raw_shop --output target/freshness.jsonOne caveat on the YAML above: dbt moved these keys under a config: block in recent releases, and loaded_at_field followed later. Older projects nest them directly under the source. Check what your project’s version expects before copying, because a misplaced key fails quietly by simply not calculating freshness at all.
Latency: name the clock before you name the number
“Our pipeline latency is twelve minutes” is meaningless until you say which two points you measured between. There are at least three plausible definitions, and teams routinely argue past each other because they’re each using a different one.
- Run duration. Start to end of the job. Easy, and mostly useless for anyone downstream.
- Ingestion latency. Source extract to target load. This is what you control.
- End-to-end latency. Event time to the moment the row is queryable. This is what the business actually feels, and it includes queue wait, scheduler delay, and every upstream hop you don’t own.
Publish end-to-end as the headline and keep the others as breakdown. If you only track run duration, a scheduler backlog that delays every run by forty minutes is completely invisible to you: each individual run still takes eleven minutes.
Instrument per stage with a histogram so you can ask percentile questions later without re-instrumenting:
histogram_quantile(
  0.95,
  sum by (le, stage) (rate(pipeline_stage_duration_seconds_bucket[6h]))
)
Use the median for capacity planning and p95 or p99 for the SLO. Averages hide the exact tail that generates the complaints, and on a pipeline that runs a few dozen times a day, a single pathological run is a real fraction of your day.
For streaming, the equivalent is consumer lag expressed in time rather than offsets. Offset lag of fifty thousand messages means nothing without a rate; two hundred seconds of lag means something to everyone. Kafka Lag Exporter popularised this by interpolating a time estimate from observed offset and timestamp samples, exposing kafka_consumergroup_group_max_lag_seconds alongside the offset-based kafka_consumergroup_group_lag. Worth knowing: that project’s repository has been archived and is read-only, so if you’re starting fresh, check whether your broker vendor or a maintained fork covers it before you deploy something unmaintained into the critical path.
Failure rate: decide what counts as a failure
Failure rate is trivially easy to compute and surprisingly easy to compute wrongly. The denominator and the definition both need a decision.
Count runs, not tasks. A DAG with sixty tasks where one flaps on a transient network error looks catastrophic at task level and fine at run level. The run is the unit the consumer cares about.
Count a run that succeeded on its third retry as a success for availability and a failure for a separate reliability metric. Both are true and they answer different questions. If your only metric folds retries into success, you will never see the slow degradation of an upstream API until it stops responding entirely.
sum by (pipeline) (rate(pipeline_runs_total{result="failure"}[6h]))
/
sum by (pipeline) (rate(pipeline_runs_total[6h]))
And add a category label for the failure reason at push time: source unavailable, schema mismatch, permission denied, timeout, validation failed. The rate tells you something is wrong. The category tells you who to wake up. Without it, every failure alert costs you a log dive before you can even route the incident.
Getting metrics out of a job that exits
Prometheus scrapes. Batch jobs finish and vanish. Pushgateway bridges that: the job pushes before exiting, and Pushgateway holds the values for Prometheus to scrape on its own schedule.
#!/usr/bin/env bash
set -euo pipefail

JOB="orders_load"
PGW="http://pushgateway.internal:9091"

start=$(date +%s)
if python /opt/pipelines/load_orders.py; then
  result=0
else
  result=1
fi
end=$(date +%s)

{
  cat <<EOF
# TYPE pipeline_run_duration_seconds gauge
pipeline_run_duration_seconds $((end - start))
# TYPE pipeline_last_run_timestamp_seconds gauge
pipeline_last_run_timestamp_seconds $end
# TYPE pipeline_last_run_success gauge
pipeline_last_run_success $((1 - result))
EOF
  if [ "$result" -eq 0 ]; then
    cat <<EOF
# TYPE pipeline_last_success_timestamp_seconds gauge
pipeline_last_success_timestamp_seconds $end
EOF
  fi
} | curl --fail --data-binary @- "$PGW/metrics/job/$JOB"

exit $result
The conditional block is doing real work. curl’s --data-binary issues a POST, and a POST to Pushgateway replaces only the metrics whose names appear in the payload, leaving the rest of the group intact. So a failing run updates the run timestamp and the success flag while leaving the previous pipeline_last_success_timestamp_seconds exactly where it was. That’s what lets time() - pipeline_last_success_timestamp_seconds keep climbing across consecutive failures. Send a PUT instead and you replace the whole group, wiping the value you needed.
On the Prometheus side, one setting is not optional:
scrape_configs:
  - job_name: pushgateway
    honor_labels: true
    static_configs:
      - targets: ['pushgateway.internal:9091']
Without honor_labels: true, Prometheus overwrites the job label your pipeline pushed with the scrape job’s own name, and every pipeline in your estate collapses into one indistinguishable series called pushgateway.
The trap worth internalising: Pushgateway never forgets. Metrics persist until something explicitly deletes them or the process restarts. A pipeline you decommissioned last quarter is still cheerfully reporting a success timestamp and a duration, and it looks alive on every dashboard. Treat Pushgateway as a cache of past executions, not a picture of current state, and use the push_time_seconds gauge that Pushgateway attaches to each group to tell the difference between a fresh push and a fossil.
If you’re on Airflow, the SLA feature is gone
This one will bite anyone upgrading. The sla and sla_miss_callback parameters were removed in Airflow 3.0, and the replacement, Deadline Alerts, arrived in 3.1. DAGs carrying the old configuration need manual migration; they don’t quietly keep working.
from datetime import timedelta

from airflow.sdk import AsyncCallback, DAG, DeadlineAlert, DeadlineReference
from airflow.providers.slack.notifications.slack_webhook import SlackWebhookNotifier

with DAG(
    dag_id="orders_load",
    deadline=DeadlineAlert(
        reference=DeadlineReference.DAGRUN_QUEUED_AT,
        interval=timedelta(minutes=45),
        callback=AsyncCallback(
            SlackWebhookNotifier,
            kwargs={"text": "orders_load has not finished 45 minutes after queuing."},
        ),
    ),
):
    ...
Note the reference point. Measuring from when the run was queued, rather than from its logical date, means scheduler backlog counts against the deadline. That’s usually what you want, because a run that sat in a queue for an hour is late to its consumers regardless of how fast it executed once it started.
There’s a structural weakness here worth naming: any alert that lives inside the orchestrator dies with the orchestrator. If the scheduler is down, nothing evaluates your deadline and nothing notifies anyone. The freshness probe from earlier is the answer, and it needs to run somewhere else. A small VPS from a provider like Contabo or InterServer running Prometheus and Alertmanager, or a hosted option like Grafana Cloud, gives you a watcher outside the blast radius of the thing being watched. This is the single highest-value piece of monitoring most data teams are missing.
Alerting without burning your on-call
The fastest way to make all of this worthless is to alert on every threshold crossing. Three rules keep it survivable.
- Set thresholds from observed behaviour, not from wishes. Look at a month of actual freshness values and set
warn_aftera comfortable margin above the normal worst case. A source that habitually passes at eleven hours against a twelve-hour threshold is not healthy, it’s one upstream hiccup from paging you. - Page on consumer impact, not internal events. A task retry is not an incident. A dataset breaching the freshness commitment its consumers rely on is. Route everything else to a channel someone reads in the morning.
- Use burn rate over multiple windows for SLOs. A short window catches fast breakage, a long window catches slow erosion, and requiring both to fire filters out the transient spikes that generate most false pages.
One more: alert on the absence of your own telemetry. A freshness gauge that stops updating is indistinguishable from one that’s fine, right up until someone asks about the numbers.
Troubleshooting
Freshness alert fires but the data looks current. Almost always a timezone problem. Your loaded_at column is in local time, now() is in UTC, and the offset shows up as a constant bias in the age. Store load timestamps in UTC and cast explicitly at read time.
Freshness flaps in and out of breach. Your check runs too close to the expected arrival. If loads land around six and your probe runs at five past, a fifteen-minute upstream delay produces an intermittent failure that trains everyone to ignore the alert. Move the probe later or widen the threshold.
Every pipeline reports as one series. honor_labels: true is missing from the Pushgateway scrape config.
A decommissioned pipeline still shows healthy. Stale group in Pushgateway. Delete the group and add a check on push_time_seconds so the next one surfaces on its own.
Latency looks fine but consumers say data is late. You’re measuring run duration and they’re feeling end-to-end. Add queue wait and event-time-to-load and the gap will be obvious.
Freshness passes, row count is near zero. The load timestamp advanced without meaningful data. This is a broken source or a stuck watermark, and it’s the reason the volume check belongs in the same probe.
Common mistakes
- Treating job success as the health signal and discovering staleness through a human.
- Running the freshness check inside the same pipeline it’s meant to police.
- Tracking freshness without volume, so a zero-row load reads as healthy.
- Reporting latency without saying which two timestamps it spans.
- Putting run IDs, batch IDs or timestamps into Prometheus labels, which multiplies your series count without bound. Those belong in traces or logs.
- Alerting on task-level failures instead of run-level outcomes, then muting the whole channel a week later.
- Assuming Pushgateway reflects current state rather than the last thing anyone pushed.
Best practices for data pipeline freshness monitoring
- Start with your three most-used tables. Full coverage is a project; three tables is an afternoon and catches most of the pain.
- Write down the freshness commitment per dataset in plain language, then encode it. “Yesterday’s orders are complete by 07:00” converts directly into a threshold.
- Name metrics consistently across pipelines. A shared prefix and a stable label set is what makes one dashboard work for all of them.
- Keep labels low-cardinality: pipeline, dataset, stage, environment, result. Nothing unbounded.
- Emit a failure category alongside every failure so alerts route themselves.
- Run the deadman check on infrastructure that doesn’t share a failure domain with the pipeline.
- Link every alert to a runbook that names the owner and the first three things to check.
Frequently asked questions
What is the difference between pipeline latency and data freshness?
Latency measures how long a specific batch of data took to travel from source to destination. Freshness measures how old the newest available record is right now, regardless of whether anything is currently running. A pipeline can have excellent latency and terrible freshness if it stopped being triggered.
How often should freshness checks run?
Frequently enough that you find out before your consumers do. A useful rule is roughly a quarter of your tolerance window: if data may be up to four hours old, check hourly. Freshness probes are cheap single-aggregate queries, so the limiting factor is usually warehouse billing rather than load.
Do I need a data observability platform for this?
Not to start. Freshness, latency and failure rate for a handful of critical datasets is a scheduled query, a push, and a few alert rules. Commercial platforms earn their cost when you need automatic column-level lineage, anomaly detection across hundreds of tables, or coverage of assets nobody has explicitly instrumented. That’s a real problem at scale, and a genuinely expensive one to build yourself. It’s just not the problem you have on day one.
How do I monitor freshness for a table that only updates weekly?
Set the threshold from the schedule plus a delivery margin, and add a deadman rule so a missing metric alerts on its own. For genuinely static reference tables, disable freshness explicitly rather than leaving a check that always warns; in dbt that means setting freshness to null for the table.
Should freshness checks fail the pipeline or just warn?
Both, in different places. Checking source freshness at the start of a job and failing hard prevents you building models on stale input, which is the cheapest bug to prevent and the most expensive to unwind. Checking output freshness after the fact should alert rather than fail, because the run is already over.
What percentile should I use for a latency SLO?
p95 for most internal analytics pipelines, p99 where downstream systems make automated decisions on the data. Track the median separately for capacity planning. Never use the average as the SLO number, because it hides exactly the tail that produces complaints.
Does this work for streaming pipelines too?
Yes, with different plumbing. Freshness becomes consumer lag measured in time, latency becomes event-time to availability-time, and failure rate becomes connector and task state plus dead-letter volume. The reasoning is identical; only the source of the numbers changes.
Conclusion
If you remember one thing, make it this: measure the data, not the job. Run status, task counts and duration all describe your code. Only freshness describes what your consumers actually receive, and it’s the one signal that stays honest when the pipeline succeeds at doing nothing.
Good data pipeline freshness monitoring is not a platform purchase. It’s a scheduled query that reports the age and volume of your most important tables, pushed somewhere durable, with a deadman rule so that silence is treated as a failure rather than as health. Add latency broken down by stage and failure rate categorised by reason, and you can answer “is the data good right now” without opening a single log file.
Need help instrumenting your pipelines?
Most of my consulting work in this area is retrofitting observability onto pipelines that already exist and can’t be paused. Specifically:
- Defining freshness and latency commitments per dataset, then translating them into thresholds and alert rules that hold up on-call.
- Adding freshness and volume probes to existing warehouses without touching the pipelines themselves.
- Wiring batch jobs into Prometheus through Pushgateway, including the grouping-key and stale-metric problems that bite six months later.
- Migrating Airflow DAGs off the removed SLA feature onto Deadline Alerts, or onto external checks that survive a scheduler outage.
- Building the Grafana dashboard that answers “is the data good right now” in one screen, with drill-down by stage and failure category.
- Cutting alert noise on pipelines where the channel has already been muted, by moving from task-level events to consumer-impact SLOs.
If you want a concrete starting point, send me a DAG file, a scrape config, or a screenshot of the dashboard you don’t trust, and I’ll tell you what I’d instrument first and why.