The ticket says the app is slow. You SSH in, run top, and there it is: wa sitting at forty percent while user CPU barely moves. Obvious conclusion, the disk is dying. Somebody opens a ticket with the host, everyone waits, and the host replies that the volume looks healthy on their side.
Sometimes the disk really is dying. More often it isn’t, and the number you’re staring at is not measuring what you think it’s measuring.
This post covers troubleshooting high I/O wait the way I’d actually do it on a production box: what the metric means, why it lies in both directions, and how to work through the five failure families that produce it.
What high I/O wait actually measures
Here’s the definition that matters: iowait is a subcategory of idle time. For a given CPU, it’s the time that CPU spent doing nothing while at least one task scheduled on it had an outstanding block I/O request.
Two consequences fall out of that, and both will burn you. High iowait can mean nothing is wrong. If the box has spare CPU and one process is pulling a large file off disk, the CPU genuinely has nothing else to do. Copying a backup will push iowait toward 100 percent on an idle host, and that’s a working system, not a fault.
Low iowait can hide a severe problem. This is the one that costs people days. If the CPU has other runnable work, the kernel context switches to it and that time gets counted as user or system, not iowait. A busy application server can be stalling badly on storage while wa reads two percent, because the CPU is never actually idle.
Add the averaging problem on top. The wa figure in top is averaged across every core. One thread pinned to one core and blocked hard on disk shows up as roughly three percent on a 32-core machine. Press 1 in top to break out per-CPU lines before you conclude anything from the aggregate.
So iowait is a hint, not a verdict. Treat it as the thing that starts the investigation, never the thing that ends it.
Start with pressure, not percentages
Pressure Stall Information is the metric I reach for first, and it exists precisely because iowait is a poor proxy for pain. It answers the question you actually care about: how much time did tasks lose because they couldn’t get I/O?
cat /proc/pressure/ioYou get two lines. some is the share of time at least one task was stalled waiting on I/O. full is the share of time every non-idle task was stalled at once, which is CPU capacity being burned for nothing. The avg10, avg60 and avg300 fields are percentages over the last 10, 60 and 300 seconds. total is a cumulative microsecond counter since boot, which is what you want for graphing because averages smooth away short spikes.
The practical rule I use: a rising full line on io is a real user-visible problem almost every time. A high some line with a flat full line usually means one noisy job is waiting while everything else gets on with its life.
If /proc/pressure doesn’t exist, the kernel was built without CONFIG_PSI, or it was built with PSI compiled in but disabled by default, in which case you need psi=1 on the kernel command line. On cgroup v2 systems you also get per-cgroup pressure, which is how you narrow from “the host is stalling” to “this container is stalling” in one command:
# Pressure for one systemd slice, useful on any modern distro
cat /sys/fs/cgroup/system.slice/io.pressure

# Pressure for every leaf cgroup that has it, sorted by nothing,
# just eyeball the full lines
find /sys/fs/cgroup -name io.pressure -exec sh -c
  'printf "%s: " "$1"; sed -n 2p "$1"' _ {} ;
If you run Prometheus, node_exporter has exposed these since it gained a pressure collector. The counters are node_pressure_io_waiting_seconds_total for some and node_pressure_io_stalled_seconds_total for full. Rate those and you have a far better storage alert than any threshold on %iowait will ever be. Grafana Cloud and Netdata both chart PSI out of the box if you’d rather not build the panels yourself.
Failure family one: the device really is saturated
This is the case everyone assumes, so get it confirmed or eliminated quickly.
iostat -xy 1The -x gives extended per-device stats. The -y matters more than people realise: without it, the first report is a since-boot average, and reading that first block is the single most common iostat mistake there is. It will tell you the disk has been fine all year, which is true and useless.
Now the columns worth your attention:
- r_await and w_await: average milliseconds a read or write took, queue time included. This is the closest thing to “how slow does storage feel”. Split reads from writes, because they fail very differently.
- aqu-sz: average queue depth. Requests either queued or in service. A depth that climbs while throughput stays flat is the signature of a genuinely saturated device.
- r/s, w/s, rkB/s, wkB/s: the actual workload. Compare against what the device or volume class is rated for.
- %util: treat with suspicion, see below.
The %util trap. That column counts the fraction of time at least one request was in flight. On a spinning disk that serviced one request at a time, it was a fair saturation signal. On NVMe and on cloud volumes that handle many requests in parallel, a device can sit at 100 percent while running at a fraction of its real capacity. Provisioning a bigger volume off the back of a 99 percent %util reading is a common and expensive way to change nothing. Use aqu-sz and the await columns instead. Similarly, svctm was deprecated and dropped from newer sysstat output because it was unreliable on parallel devices; ignore it if an old build still prints it.
Once you know the device is busy, find the culprit. pidstat -d 1 gives per-process read and write rates from the same sysstat package and needs nothing special enabled. iotop -o is friendlier, but on kernels from 5.14 onward per-task delay accounting is off by default, so the SWAPIN and IO> columns come back empty until you turn it on:
sudo sysctl kernel.task_delayacct=1
sudo iotop -oPa
# turn it back off when you're done, it costs a little scheduler overhead
sudo sysctl kernel.task_delayacct=0
And check the boring things before the clever ones. dmesg -T | grep -iE 'i/o error|reset|medium' catches a failing drive or a flapping controller. smartctl -a /dev/sda catches reallocated sectors on hardware you own. If either of those turns something up, stop reading and replace the disk.
Failure family two: memory pressure in an I/O costume
This is the failure family I’d check second, and it’s invisible if you only look at storage.
When RAM gets tight, the kernel starts evicting page cache and swapping. Both generate disk traffic. The disk gets busy, iowait climbs, and every graph points at storage while the actual constraint is memory. Give the box more RAM and the “disk problem” disappears.
# si and so are swap-in and swap-out in KB/s.
# Sustained non-zero values are your answer.
vmstat 1

# Are we thrashing writeback? Dirty pages waiting to be written.
grep -E 'Dirty|Writeback' /proc/meminfo

# The direct question
cat /proc/pressure/memory
If memory pressure and I/O pressure rise together, fix memory first. Everything else is downstream.
There’s a related trap on the write side. The kernel buffers writes in page cache and flushes them in the background, governed by vm.dirty_background_ratio and vm.dirty_ratio. Cross the background threshold and flusher threads start writing. Cross the hard vm.dirty_ratio threshold and writing processes are forced to do writeback themselves, synchronously. That transition is brutal, and on a box with plenty of RAM and a modest disk the defaults let you accumulate gigabytes of dirty pages and then pay for all of them at once. Lowering the ratios makes writeback more frequent and less spiky, trading away a little write batching. Measure before you commit to it.
Failure family three: small synchronous writes
Throughput can be trivial and the system still crawls. A workload doing thousands of tiny fsync calls a second is bound by round-trip latency, not bandwidth, and no amount of extra megabytes per second will help.
Databases are the usual source, because durability has a cost and that cost is a flush. MySQL and MariaDB expose it through innodb_flush_log_at_trx_commit; PostgreSQL through synchronous_commit. Loosening either buys real throughput and trades away durability on power loss or crash. That can be a perfectly reasonable trade for a cache or an analytics replica, and a terrible one for anything holding orders or payments. Decide it explicitly, write down what you decided, and don’t let it be a thing somebody changed once at 2am.
The other common source is logging. Application logs, access logs, container JSON logs and a database sharing one volume will starve each other. Splitting hot write paths onto separate devices is unglamorous and works.
Failure family four: throttled, not saturated
A throttled device and a saturated device look almost identical from inside the guest: high await, growing queue, miserable latency. The difference is that no amount of tuning inside the box will fix a throttle. Three flavours are worth knowing.
- Cloud volume limits. Managed block storage gives you a baseline of IOPS and throughput, sometimes with a burst allowance on top. Burn the burst and you drop to baseline, and everything that was fine in testing falls over in production. The tell is a latency cliff that arrives at a consistent point into a workload rather than tracking load smoothly. On AWS, watch the volume-level CloudWatch metrics such as
BurstBalanceon burstable volume types andVolumeQueueLength; other providers publish equivalents. The fix is a volume class change, not a sysctl. - cgroup limits you set yourself. On cgroup v2,
io.maxcaps a cgroup at a given bytes-per-second or IOPS figure, andio.weightshares bandwidth proportionally under contention. A limit that made sense when it was written can become the bottleneck a year later, and nothing in the container’s own metrics announces it. - Neighbours on shared hardware. On oversubscribed VPS plans your storage is shared, and someone else’s backup job is your latency spike. This is where cheap and expensive hosting genuinely differ. Budget providers like Contabo and InterServer are fine value for a lot of workloads, but if storage latency is load-bearing for you, look for plans with dedicated NVMe rather than shared pools, and test before you migrate anything that matters.
# Per-device I/O accounting for a cgroup, including any throttling
cat /sys/fs/cgroup/system.slice/docker-<id>.scope/io.stat

# Is a cap set? An empty file means no limit on that cgroup.
cat /sys/fs/cgroup/system.slice/docker-<id>.scope/io.max
One more signal while you’re here. In top, the st column is steal time, meaning the hypervisor gave your vCPU’s slice to someone else. Steal and iowait rising together on a shared host is a strong hint that the problem is the neighbourhood, not your configuration.
Failure family five: the latency isn’t in the block layer
Here’s the failure mode that wastes the most time, because every storage metric you check will look healthy.
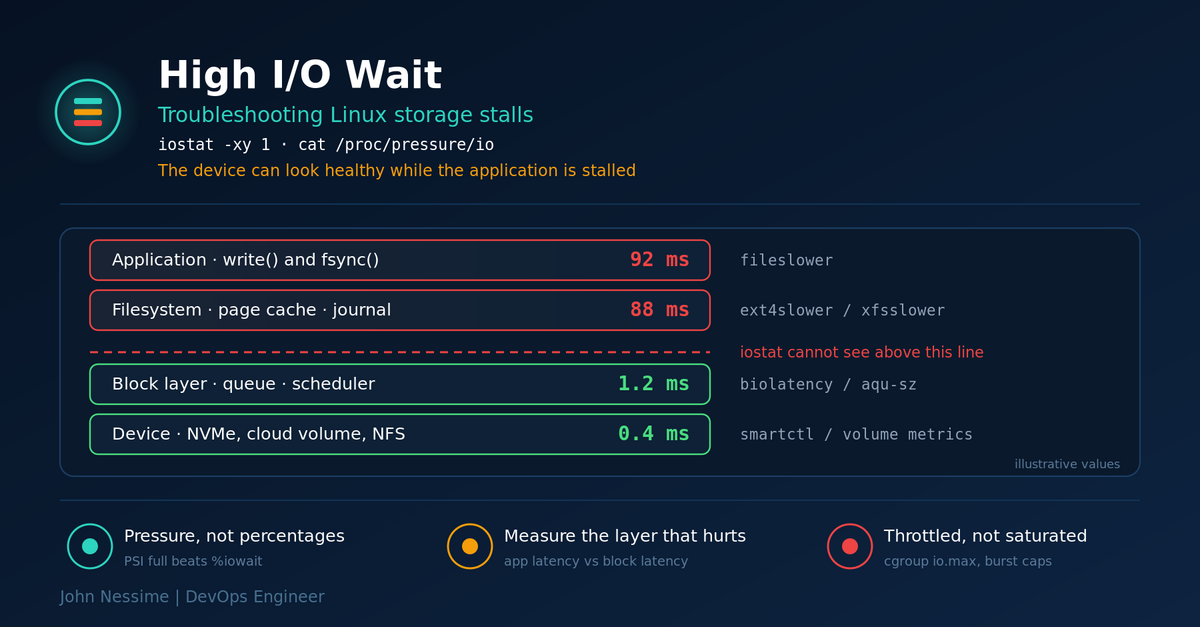
iostat measures the block layer. It cannot see anything above it. So if your latency is in NFS, in a network filesystem, in an overlay or FUSE mount, in filesystem lock contention, or in a journal that’s serialising writes, the device will report sub-millisecond service times while your application waits tens of milliseconds per operation.
The diagnosis is the gap. Measure latency at the application’s layer and at the block layer, and if the two numbers disagree wildly, the problem lives in between.
# Block layer latency as a histogram. Look for a bimodal shape
# or a long tail rather than the average.
sudo biolatency-bpfcc -m 10 1      # Debian/Ubuntu naming
sudo /usr/share/bcc/tools/biolatency -m 10 1   # RHEL family

# Filesystem operations slower than 10ms, with the process and file
sudo ext4slower-bpfcc 10
sudo xfsslower-bpfcc 10

# Everything at the VFS layer, higher overhead, use briefly
sudo fileslower-bpfcc 10
If ext4slower is full of hundred-millisecond operations and biolatency shows everything completing in microseconds, you have your answer and it is not the disk. For NFS specifically, nfsiostat splits out RTT from execution time, which separates network cost from server cost. Install the tooling with bpfcc-tools on Debian and Ubuntu, or bcc-tools on RHEL, AlmaLinux and Rocky.
A working order for troubleshooting high I/O wait
On an unfamiliar box, this is the sequence I work through. Each step either finds the problem or eliminates a family.
- Read
/proc/pressure/io. Iffullis near zero, the stall is not hurting the whole system and you should widen the search before you tune storage. - Check
/proc/pressure/memoryat the same time. If it’s rising too, fix memory first. - Run
iostat -xy 1for thirty seconds. Noter_await,w_awaitandaqu-szper device. Ignore%util. - List processes stuck in uninterruptible sleep:
ps -eo state,pid,comm | awk '$1 ~ /^D/'. That’s your blocked set, and it names the workload. - Attribute the traffic with
pidstat -d 1. Confirm the process you suspect is the process actually doing the I/O. - If await is high, decide saturated versus throttled. Check cgroup
io.max, check provider volume metrics, check steal time. - If await is low but the application is slow, jump to the layer gap. Run
biolatencyandext4slowertogether and compare. - Only now consider tuning: dirty ratios, I/O scheduler, flush settings, splitting volumes.
Common mistakes
- Reading iostat’s first report. It’s a since-boot average. Use
-y, or discard the first block. - Trusting %util on NVMe or cloud volumes. Parallel devices break the assumption it was built on.
- Alerting on a fixed %iowait threshold. It fires on healthy backups and stays silent during real stalls on busy hosts.
- Changing the I/O scheduler first. Going from
mq-deadlinetononeon NVMe is sometimes right, but it’s a tuning step, not a diagnosis, and it fixes nothing if you’re throttled. - Adding swap to fix swapping. More swap on a memory-starved box means more disk traffic, not less.
- Stopping at the block layer. If every storage metric looks clean and the app is still slow, you’re measuring at the wrong layer, not measuring a healthy system.
- Testing with the wrong benchmark. A sequential
ddtells you nothing about a workload doing random 4K synchronous writes. Usefioand match the real access pattern.
Best practices worth the effort
- Record PSI continuously. Storage incidents are short and bursty. Without history you’re guessing about something that already ended.
- Capture a baseline while things are healthy. Save an
iostat -xysample and a PSI reading from a normal day. “Is 8ms bad?” is unanswerable without one. - Keep sar running. The sysstat package can archive metrics on a schedule, which means
sar -dcan show you what happened at 3am. Enable it before you need it. - Separate hot write paths. Database data, database logs and application logs on separate volumes stops one from starving the others.
- Cap container logs. An uncapped JSON log driver quietly filling the root volume is a recurring cause of host-wide stalls.
- Alert on latency and pressure, not utilisation. Users feel
w_awaitand PSIfull. Nobody has ever felt a percentage of device busy time.
Frequently asked questions
What is a normal or acceptable I/O wait percentage?
There isn’t one, and any article that gives you a single number is guessing. Iowait scales with how idle your CPUs are, so the same workload produces very different figures on a busy server and a quiet one. Judge against your own baseline, and prefer PSI, which measures lost time directly rather than as a share of idle.
Can high I/O wait be caused by something other than the disk?
Regularly. Memory pressure driving swap and page cache eviction is the most common non-disk cause. Network filesystems, hypervisor contention on shared hosts, and cgroup or cloud volume throttling all produce the same symptom. The block device being genuinely slow is one possibility among several.
Why does iostat show 100% utilisation when the disk isn’t busy?
Because %util measures the fraction of time at least one request was in flight, which made sense for devices that handled one request at a time. NVMe drives and cloud volumes process many requests in parallel, so they can be continuously occupied while nowhere near capacity. Read aqu-sz and the await columns instead.
How do I find which process is causing I/O wait?
Start with pidstat -d 1, which needs no special kernel settings. List processes in uninterruptible sleep with ps -eo state,pid,comm and filter for state D to see who is actually blocked. iotop -o gives a live view but needs kernel.task_delayacct=1 on recent kernels for its percentage columns to populate.
Does adding more RAM reduce I/O wait?
Often, yes, and it’s underrated. More RAM means a larger page cache, fewer reads reaching the device, and less swapping. If vmstat shows sustained swap activity or memory pressure tracks I/O pressure, RAM is likely the cheapest fix available.
Should I change the I/O scheduler to fix high I/O wait?
Only after you know the device is the bottleneck. Check the current setting with cat /sys/block/sda/queue/scheduler. On NVMe, none is a common and sensible default because the hardware already does the queuing. On spinning disks, mq-deadline or bfq give better latency behaviour. It’s a tuning knob, not a diagnostic, and it will not help if you’re being throttled.
Why is my application slow when iostat says storage is fine?
Because iostat only sees the block layer. Latency in NFS, FUSE, overlay filesystems, journal serialisation or filesystem locking is entirely invisible to it. Run ext4slower or xfsslower alongside biolatency: if the filesystem is slow and the device is fast, the gap between them is your problem.
The one thing worth remembering
High I/O wait is a symptom that points in a general direction, not a diagnosis. It’s a slice of idle time, averaged across cores, measured at one specific layer of the stack. It goes up when nothing is wrong and stays flat when something is very wrong.
Read PSI to find out whether anyone is actually suffering. Read r_await, w_await and aqu-sz to find out whether the device is the constraint. Compare filesystem latency against block latency to find out whether you’re even looking at the right layer. Do those three things and the answer usually falls out in a few minutes, instead of after a week of arguing with your hosting provider about a volume that was fine all along.
Need someone to look at your storage stalls?
I work with teams on exactly this kind of problem, usually the ones that have already survived a round of “the host says the disk is fine”. Things I can help with:
- Diagnosing a live or recurring I/O stall and identifying which failure family it belongs to
- Setting up PSI, sar and per-cgroup I/O metrics in Prometheus and Grafana, with alerts that fire on latency rather than utilisation
- Separating cloud volume throttling from genuine device saturation, and sizing storage correctly instead of guessing upward
- Tuning writeback, dirty ratios and I/O schedulers for a specific workload, with before-and-after measurements
- Tracing container and Kubernetes I/O contention through cgroup v2 limits, overlay filesystems and log drivers
- Benchmarking with
fioagainst your real access pattern so capacity decisions rest on something other than addrun
If you’ve got an iostat capture, a PSI reading or just a graph that doesn’t make sense, send it over and I’ll tell you what I see in it.