The message usually arrives on a Monday. An analyst pings you: “the dashboard is showing last week’s numbers.” You open Grafana, look at the pipeline board, and every panel is calm. No red. No spikes. Error counts flat at zero.
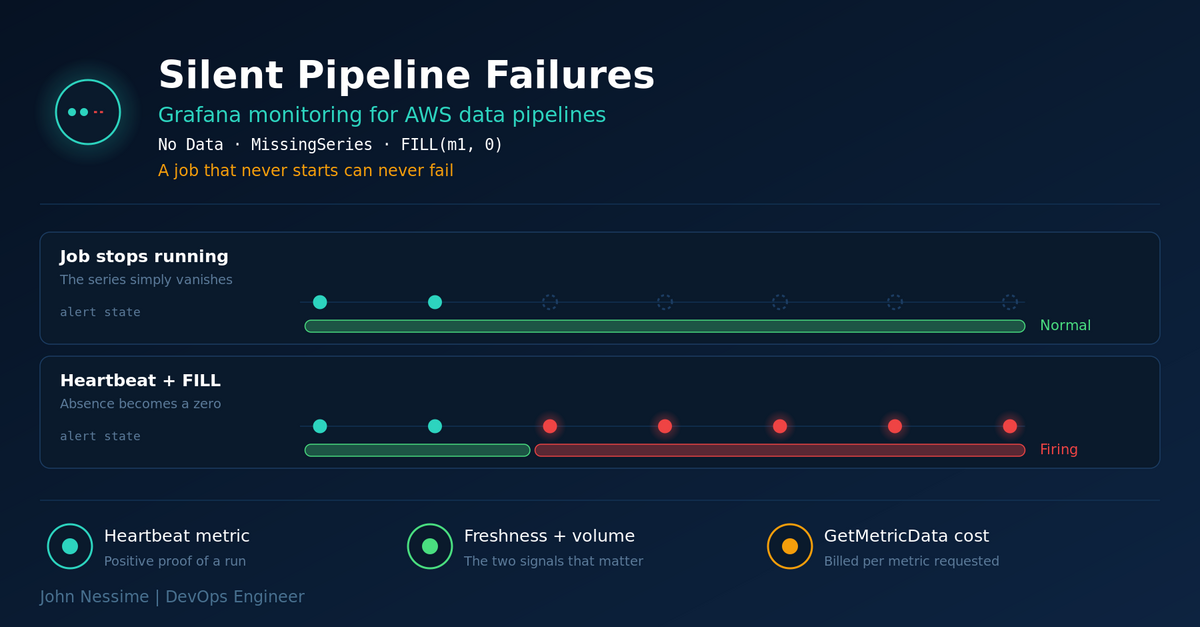
Then you check the Glue job history and the last successful run was six days ago. The job has not failed. It has not run at all. Because it never ran, it never emitted a metric, so CloudWatch recorded nothing and Grafana drew nothing. The panel is not green because the pipeline is healthy. It is green because the pipeline is silent.
That gap is the most common problem I see with Grafana monitoring for AWS data pipelines, and it is not a Grafana bug. It follows from how AWS batch services emit metrics and how alert engines read an empty result set. This post covers that failure and the three that follow close behind: wrong signal, cost, and access. Then the dashboard layout, the alerting rules, and a troubleshooting list for empty panels.
Failure family one: the pipeline stopped and nothing turned red
Application metrics are continuous. A web server emits request counts every minute forever, so a gap in the line genuinely means something is wrong.
Pipeline metrics are not like that. Glue reports job metrics only while a job executes, and only if job metrics are enabled and the script initialises a GlueContext. Step Functions publishes execution metrics when executions happen. MWAA publishes DAG metrics when DAGs run. Between runs the metric does not exist. A daily job produces a few minutes of data and twenty-three hours of nothing.
So the question that decides whether your monitoring works is: what does your alert engine do with an empty result?
No Data and MissingSeries are not the same thing
- No Data means the query returned no data points at all. Grafana handles this with a per-rule setting and by default raises a separate alert named
DatasourceNoData. That alert does not inherit your rule’s labels and it fires immediately, skipping the pending period. If your notification policy routes on a team label, it will not match. - MissingSeries means the query still returns data but one series has disappeared. That is the dead-job case exactly: a query for failed tasks across all Glue jobs still returns rows for the jobs that ran, and the dead one just stops existing. Grafana holds the last state for a couple of evaluation cycles, then evicts the instance with a transition to Normal, annotated with
grafana_state_reasonset toMissingSeries.
Read that again, because it is the whole problem. A job that stops running produces an alert that resolves itself and sends a cheerful “back to normal” notification. Nobody investigates a resolution.
The fix: stop inferring health from absence
Do not build the “did it run” signal out of metrics that only exist when it runs. Publish a heartbeat: a custom metric your pipeline writes once, deliberately, at the point you consider the run complete.
aws cloudwatch put-metric-data
  --namespace "Pipelines"
  --metric-name "RunCompleted"
  --dimensions PipelineName=orders_daily
  --value 1
  --unit Count
Put that at the end of the Glue script, in the final Step Functions state, or in the last task of the DAG. Now “did it run” has a positive signal instead of an inferred one.
The heartbeat is still sparse, so you also need to tell the evaluator that absence means failure. In a CloudWatch alarm, that is the missing-data setting: the options are missing, ignore, breaching and notBreaching, and for a heartbeat you want breaching.
aws cloudwatch put-metric-alarm
  --alarm-name "orders_daily-heartbeat-missing"
  --namespace "Pipelines"
  --metric-name "RunCompleted"
  --dimensions Name=PipelineName,Value=orders_daily
  --statistic Sum
  --period 3600
  --evaluation-periods 26
  --threshold 1
  --comparison-operator LessThanThreshold
  --treat-missing-data breaching
  --alarm-actions arn:aws:sns:REGION:ACCOUNT_ID:pipeline-alerts
One subtlety here bites people. CloudWatch looks back over an evaluation range wider than your evaluation periods, and if it finds enough real data points in that wider range, the missing-data setting is ignored entirely. For a once-a-day metric that behaviour can suppress the alarm you just built. The reliable way around it is metric math: fill the gaps before the alarm evaluates anything.
FILL(m1, 0)Now every period has a value, zero means “no run completed”, and a plain threshold behaves the way you expected. FILL(m1, REPEAT) and FILL(m1, LINEAR) carry the last known value or interpolate instead, which suits gauges better than heartbeats.
On the Grafana side, set the no-data state explicitly on each rule and build a notification policy that catches alertname=DatasourceNoData, otherwise those alerts go nowhere. The heartbeat still matters even with that in place, because it turns a disappearing series into a present series with a bad value, and every rule engine handles that correctly.
Failure family two: you are monitoring the compute, not the data
The second failure is subtler. The job runs, succeeds, takes its usual time, and writes nothing, because an upstream API returned an empty page or a partition filter matched no files. Executor CPU and heap will not tell you that. Two signals will.
Freshness is time since the last successful completion, per pipeline. It maps directly onto “can I trust the report on my screen”, which is the only question your stakeholders are asking. Derive it from the heartbeat.
Volume is rows or bytes written per run, compared against the same run last week. A drop to zero with a successful exit code is the classic empty-load bug. For Spark jobs on Glue the built-in counters give you a usable start:
glue.driver.aggregate.recordsReadandglue.driver.aggregate.bytesReadfor input volumeglue.driver.aggregate.numFailedTasksfor partial failures that do not fail the jobglue.driver.s3.filesystem.write_bytesand theglue.ALLequivalents for output across executors
Glue reports these roughly every thirty seconds as deltas from the previous report, so Sum over the run window is usually what you want rather than Average. Beyond those, the signals I put on a board first are ExecutionsStarted minus ExecutionsSucceeded from the AWS/States namespace, since aborted and timed-out executions land in separate counters and failure count alone misses them; DAG metrics from the AmazonMWAA namespace, remembering that metrics.metrics_allow_list and metrics.metrics_block_list control what reaches CloudWatch at all; consumer lag rather than throughput on streaming ingestion, because a stream will happily accept records nobody is reading; and message age on dead letter queues, which is a near-perfect proxy for “something is failing repeatedly and nobody noticed”.
Failure family three: the dashboard costs more than the pipeline
Grafana’s CloudWatch data source uses GetMetricData to fetch samples and ListMetrics when you pick dimensions in the editor. GetMetricData does not qualify for the CloudWatch API free tier, and it is billed per metric requested rather than per API call. One request pulling five hundred metrics is five hundred billable metric requests.
Now multiply: panels, times series per panel, times statistics per series, times refresh rate, times every user with the board open, times every alert rule on its own schedule. A wildcard query matching every Glue job in the account looks tidy in the editor and quietly becomes the largest line item in your monitoring bill. Asking for more than five statistics on one metric counts as an extra metric request too.
The levers, roughly in order of return:
- Set a sane refresh interval. Metrics that arrive every thirty seconds do not need a five-second refresh, and a daily batch board does not need auto-refresh at all.
- Replace wildcard dimension matching with explicit resource lists on always-open boards. Keep wildcards for ad hoc investigation.
- Query only the regions you run in. It is easy to leave a data source pointed at a region you migrated out of.
- Use template variables instead of one duplicated board per team.
- If you pull a large metric catalogue continuously, evaluate CloudWatch metric streams. Streams push through Amazon Data Firehose to a destination you control, and AWS recommends that path for third-party tools with heavy
GetMetricDatausage. The trade-off is genuine: you lose metric math and Metrics Insights against CloudWatch directly, and you pick up storage and Firehose ingestion costs instead.
To find which client is driving the spend, enable CloudTrail data events on GetMetricData. It surfaces the calling IAM principal and source address, which is usually enough to identify the forgotten dashboard.
Failure family four: access, accounts and regions
Grafana ships CloudWatch support natively, so there is no plugin to install. What there is, is an IAM policy people habitually make too broad or too narrow. This is the read-only set the data source needs:
{
  "Version": "2012-10-17",
  "Statement": [
    {
      "Sid": "AllowReadingMetricsFromCloudWatch",
      "Effect": "Allow",
      "Action": [
        "cloudwatch:DescribeAlarmsForMetric",
        "cloudwatch:DescribeAlarmHistory",
        "cloudwatch:DescribeAlarms",
        "cloudwatch:ListMetrics",
        "cloudwatch:GetMetricData",
        "cloudwatch:GetMetricStatistics"
      ],
      "Resource": "*"
    },
    {
      "Sid": "AllowReadingRegions",
      "Effect": "Allow",
      "Action": "ec2:DescribeRegions",
      "Resource": "*"
    },
    {
      "Sid": "AllowReadingResourcesForTags",
      "Effect": "Allow",
      "Action": "tag:GetResources",
      "Resource": "*"
    }
  ]
}
Prefer an assumed role over long-lived access keys. If Grafana runs on EC2 or ECS in the same account, the instance or task role is cleanest and there is no secret to rotate.
Two boundaries to plan for. CloudWatch quotas are defined per account and per region, so a multi-account estate can hit limits in one account while the rest are fine, and each needs its own quota increase. And metrics do not cross regions: a pipeline that reads in one region and writes in another needs both on the board, and the missing half is a common reason a panel looks empty for no obvious cause.
Where to run Grafana for this
Three options, and the choice is mostly about viewer count and who carries the operational load.
- Amazon Managed Grafana bills per active user license per workspace, split into editor and viewer tiers, with at least one editor license required per workspace even if nobody logs in. An active user is anyone who logged in or made an API request during the billing cycle. Excellent for a small engineering team, expensive if you hand read-only boards to a large business audience.
- Grafana Cloud from Grafana Labs bills on usage rather than seats, which flips that calculation. It also brings the AWS observability integrations and Grafana Alloy if you want CloudWatch metrics in a Prometheus-compatible store.
- Self-hosted is cheapest per seat and most work. A small VPS from a provider like Contabo or InterServer runs Grafana for a handful of pipelines comfortably, and you own upgrades, TLS renewal and backups. One licensing note: Grafana’s open source core moved from Apache 2.0 to AGPLv3, while plugins and agents stayed Apache-licensed. If your legal team has a policy on AGPL, have that conversation before deployment.
Laying out a board people actually read
Organise by question, not by service. Whoever opens this board on a Monday morning has one question, and the answer should be visible without scrolling.
- Freshness table. One row per pipeline, hours since last successful completion, threshold colour tied to that pipeline’s actual SLA. Most viewers read only this row.
- Volume against baseline. Records or bytes written per run, overlaid with the same period a week ago.
- Failure counts and durations, grouped by stage so a slow extract is distinguishable from a slow load.
- Resource detail at the bottom. Executor memory, DPU usage, throttling. Useful during an incident, noise the rest of the time.
Use a template variable for pipeline name rather than one board per pipeline. It keeps the query count down and new pipelines appear automatically. For cross-pipeline aggregation without fanning out into individual series, CloudWatch Metrics Insights runs a SQL-style query inside CloudWatch and the Grafana data source supports it:
SELECT SUM(ExecutionsFailed)
FROM SCHEMA("AWS/States", StateMachineArn)
GROUP BY StateMachineArn
Each GetMetricData operation can carry only one Metrics Insights query, so treat it as a way to consolidate one fan-out, not to run several at once.
Troubleshooting: why the panel is empty
- Check the region on the query, not the data source. Grafana allows a per-query region override and it is easy to leave one on default.
- Widen the time range to seven days. If data appears, the metric is sparse and you have a heartbeat problem, not a query problem.
- Check the statistic. Sum and Average behave very differently on delta counters, and empty-looking panels are often Average over a window that is mostly gaps.
- Check dimensions match exactly. With Match Exact on, every dimension must be specified, so a metric published with two dimensions returns nothing when queried with one. Turning Match Exact off makes Grafana generate a search expression instead, which is the usual fix.
- Check job metrics are enabled. For Glue you need both the job metrics option and a GlueContext in the script. Without the GlueContext, nothing is emitted regardless of the console setting.
- Check IAM. A role with
ListMetricsbut notGetMetricDatapopulates every dropdown perfectly and returns no data, which is confusing until you have seen it once. - Check for throttling. Panels that are intermittently empty under load rather than consistently empty usually mean a CloudWatch API quota for that account and region.
For alert rules behaving oddly rather than panels, treat the Error state separately from No Data. Grafana raises DatasourceError on evaluation timeouts or repeated query failures, governed by the evaluation_timeout and max_attempts settings. Slow CloudWatch queries under quota pressure trip this, and the resulting alert looks nothing like the one you wrote.
Common mistakes
- Alerting on failure counts only. A job that never starts cannot fail, so failure-count alerting is blind to the most common outage.
- Leaving no-data handling on the default and never routing
DatasourceNoData. The alert fires into the void. - Treating a MissingSeries resolution as good news. If alerts resolve without anyone acting, check the reason annotation.
- Importing a large community dashboard pack wholesale. Most of those panels use wildcards, and you have just subscribed to a permanent
GetMetricDatabill for metrics nobody reads. - Monitoring the orchestrator but not the destination. Step Functions reports a clean success while the load that ran inside it wrote zero rows.
Best practices worth the effort
- Emit a heartbeat from every scheduled pipeline using one consistent namespace and dimension scheme. Consistency is what lets a single dashboard cover everything.
- Write down a freshness SLA per pipeline, then set the threshold from it. “Alert if stale” only means something once someone says how stale is too stale.
- Provision dashboards and alert rules as code in the same repository as the pipeline. A pipeline that ships without its monitoring is not finished.
- Route by severity, not by service. Freshness breaches page; executor memory warnings go to a channel.
- Break something on purpose to test the alert. Disable the schedule on a non-production pipeline and confirm you get paged. An untested alert is a guess.
Frequently asked questions
Do I need a plugin to connect Grafana to CloudWatch?
No. Grafana includes native support for the Amazon CloudWatch data source. Configure credentials or an assumed role, set a default region, and query. The same data source also reaches CloudWatch Logs and X-Ray.
Why does my Grafana alert resolve itself when the pipeline is still broken?
Almost certainly MissingSeries eviction. When one series in a multi-series query disappears, Grafana holds the last state briefly and then transitions the instance to Normal with grafana_state_reason set to MissingSeries. It is not treated as No Data. A heartbeat metric with gaps filled to zero stops the series disappearing in the first place.
CloudWatch dashboards or Grafana for AWS data pipelines?
CloudWatch dashboards are the shorter path if everything sits in one account and the visualisation options suit you. Grafana earns its place when you need pipeline metrics correlated with a warehouse query, a database, a trace or a business KPI on one screen, and when alerting has to route to several destinations. Most data platforms end up wanting the correlation.
How do I monitor a Glue job that succeeds but writes no data?
Alert on output volume rather than exit status. Use the Glue write byte counters, or better, emit your own row-count metric after the write so it reflects what your code believes it wrote. Compare against the equivalent run a week earlier, because fixed thresholds age badly as data grows.
Does Grafana querying CloudWatch cost money?
Yes. Grafana uses GetMetricData, which is billed per metric requested and excluded from the CloudWatch API free tier. Cost scales with panels multiplied by series multiplied by refresh frequency multiplied by viewers, so wildcards on an auto-refreshing board are the expensive pattern. Check current rates on the CloudWatch pricing page and do the arithmetic for your own board.
Amazon Managed Grafana or self-hosted?
It comes down to viewer count. Managed Grafana bills per active user per workspace, which suits a small engineering team and gets costly when read-only dashboards go out widely. Self-hosting removes the per-seat cost and adds upgrade, TLS and backup work. Grafana Cloud sits between them on usage-based billing. Count likely viewers first, then choose.
What is the minimum useful monitoring for a new pipeline?
A heartbeat proving the run completed, a row or byte count proving it moved something, and an alert that fires when the heartbeat is missing for longer than the agreed freshness window. Everything else is refinement.
The one thing to take away
Effective Grafana monitoring for AWS data pipelines is not about drawing more metrics. It is about refusing to infer health from absence. Batch pipelines are silent most of the time, and every monitoring system in existence reads silence as calm unless you tell it otherwise.
Publish a heartbeat. Fill the gaps with zero. Set your no-data behaviour deliberately. Then alert on freshness and volume, because those are the two things people downstream will notice before you do. Do that, and a green panel means something.
Need help building this on your AWS estate?
I design and build monitoring for AWS data platforms. This is the kind of work I take on:
- Heartbeat and freshness instrumentation across Glue, Step Functions, MWAA and Lambda pipelines, with one consistent namespace scheme so a single dashboard covers everything
- Grafana dashboards built around freshness and volume rather than executor charts nobody reads
- Alert rules and notification policies that handle No Data and MissingSeries correctly, routed to Slack, Teams, Telegram or email by severity
- CloudWatch query cost reviews, tracing
GetMetricDataspend back to the dashboard or rule causing it - Cross-account and multi-region data source setup with least-privilege IAM roles instead of long-lived keys
- Grafana deployment and hardening on Amazon Managed Grafana, Grafana Cloud or a self-hosted instance behind TLS
If you have a pipeline that failed quietly, send me the job definition, the alert rule, or a screenshot of the panel that stayed green. I would rather look at the actual thing than talk in generalities.