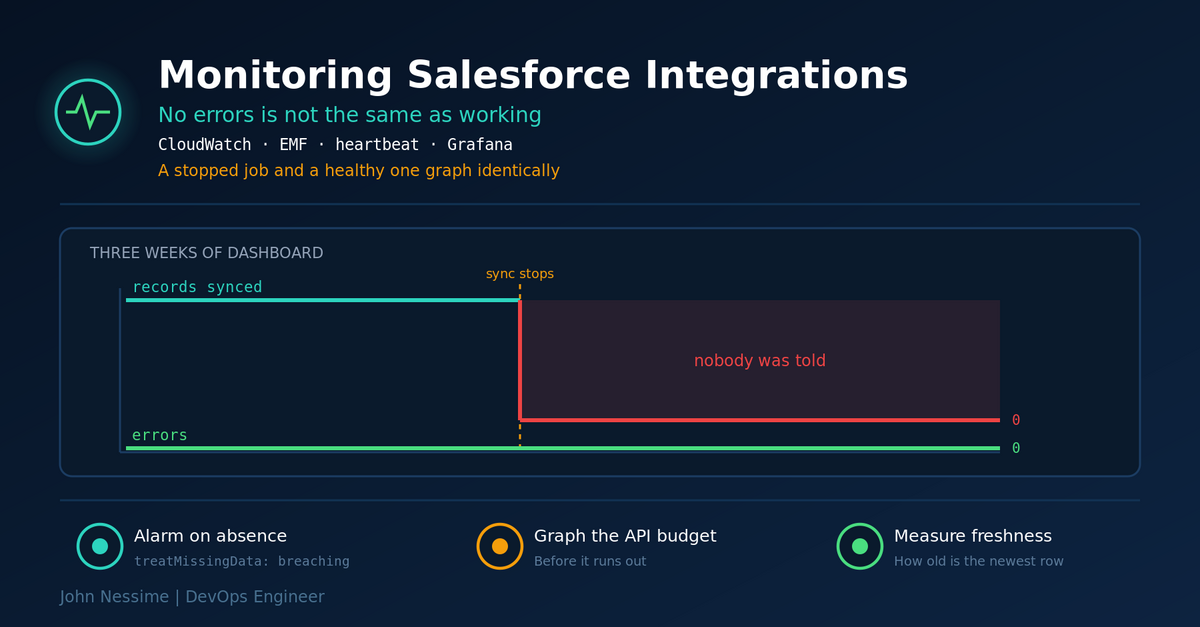
Sales ops asks why an account they created three weeks ago still isn’t in the warehouse. You open the dashboard for the sync. Error count: zero. Every day, flat, zero. The alarm is not firing.
Then you check the invocation count and it is also zero, and has been since the day somebody disabled an EventBridge rule while cleaning up a different stack. The job has not run in three weeks. It never errored because it never started.
This is the shape of almost every integration monitoring failure: a healthy graph and a stopped job produce identical output. Zero errors is what success looks like and it is also what absence looks like, and if the only thing you measure is failure, the two are indistinguishable.
This is about how to monitor Salesforce integrations so that stopping is as loud as breaking. Four signals worth emitting, how to get them into CloudWatch cheaply, the alarm configuration that actually fires, and what belongs on a Grafana dashboard once you have them.
Four signals, not one
Most integration monitoring stops at errors and duration, because those come free from Lambda or your container platform. Both are worth having and neither answers the question anybody actually asks, which is “is the data right”.
The four that do:
- Liveness. Did it run at all?
- Volume. Did it move a plausible amount of data?
- Freshness. How old is the newest record on the destination side?
- Budget. How much of Salesforce’s daily API allowance have you spent?
Errors are a fifth, and the least interesting, because errors are the failure mode that already announces itself.
Liveness: the alarm that has to fire on silence
Emit a metric on every successful completion. A single count, value 1. Then alarm when it stops arriving.
The trap is in the CloudWatch defaults. TreatMissingData has four settings, and the default is missing, which sends the alarm to INSUFFICIENT_DATA when nothing arrives. That state is not ALARM. Nothing pages. Your dashboard shows a grey alarm that most people read as “fine”.
So heartbeat alarms need breaching. That much is standard advice. Here is the part that is not: even with breaching set, a heartbeat alarm can still fail to fire. CloudWatch evaluates over a range wider than your evaluation periods, and if it finds any real data point in that wider range, those override the missing ones. On a job that runs hourly, a successful run from earlier can keep the alarm quiet through several missed runs.
The robust version uses metric math to turn absence into a real zero, so there is no missing data to interpret:
aws cloudwatch put-metric-alarm
  --alarm-name "opportunity-sync-not-running"
  --alarm-description "No completed run in the last 90 minutes"
  --comparison-operator LessThanThreshold
  --threshold 1
  --evaluation-periods 1
  --treat-missing-data breaching
  --alarm-actions "$SNS_TOPIC_ARN"
  --metrics '[
    {
      "Id": "runs",
      "MetricStat": {
        "Metric": {
          "Namespace": "SalesforceSync",
          "MetricName": "RunCompleted",
          "Dimensions": [{"Name": "Integration", "Value": "opportunity-sync"}]
        },
        "Period": 5400,
        "Stat": "Sum"
      },
      "ReturnData": false
    },
    {
      "Id": "filled",
      "Expression": "FILL(runs, 0)",
      "ReturnData": true
    }
  ]'
FILL(runs, 0) substitutes a zero wherever the metric has no data point, so the alarm always has something real to compare against the threshold. The window is deliberately longer than the schedule: an hourly job gets ninety minutes, so one late run does not wake anybody.
Then do the thing everyone skips: disable the schedule in a test account and confirm the alarm actually goes red. An untested alarm is a belief, not a control.
Volume and freshness: is the data actually moving
A job can complete successfully and process nothing. A credential with the wrong field-level permissions, a filter that silently matches nothing, a watermark that got written before the data landed: all of these produce a clean run and an empty result.
Volume is the count of records read and written per run. Alarming on it is harder than liveness because the right number varies: a quiet Sunday legitimately looks like a broken Tuesday. Two approaches that work. Use CloudWatch anomaly detection, which learns the daily and weekly shape and alarms on departures from it. Or set a crude floor that only catches the catastrophic case, which is usually zero, and accept that you will not catch a fifty percent drop.
I would start with the crude floor. It is five minutes of work and catches the failure that actually happens.
Freshness is the better metric and almost nobody emits it. At the end of each run, query the destination for the newest record’s modified timestamp, subtract it from now, and publish the difference in seconds. That single number answers the business question directly: how far behind Salesforce are we right now?
It also collapses several failure modes into one signal. A stopped job, a job that runs but writes nothing, a job stuck retrying, a job silently filtered down to zero rows: all of them show up as lag climbing. If you only add one metric from this post, add this one.
Budget: watch the Salesforce allowance
Your org has a daily API allowance shared across every integration touching it. Exceeding it does not just break your sync; it breaks marketing automation, support tooling, and whatever else somebody connected two years ago.
Enforcement is initially soft, and then it is not: past a protection threshold, calls come back as 403 with REQUEST_LIMIT_EXCEEDED until the rolling window drains. By that point you are in an incident that spans several teams.
The good news is that this costs nothing to observe. Salesforce returns your current consumption on ordinary REST responses in a header, so you get it on calls you were making anyway:
# Sforce-Limit-Info: api-usage=1212/15000
#
# Free: no extra API call, which matters when the thing you are
# measuring is an API budget. Add real error handling before
# shipping this; the header is not guaranteed on every response.
raw = response.headers.get("Sforce-Limit-Info", "")
used, allowed = (int(v) for v in raw.split("api-usage=")[1].split("/"))
emit("ApiUsagePercent", used / allowed * 100)
For a fuller picture, the /services/data/vXX.X/limits endpoint returns every allocation in the org, including DailyApiRequests with its max and remaining values. It needs the View Setup and Configuration permission and the numbers lag by a few minutes. Poll it on a schedule rather than per request, and alarm on percentage consumed rather than absolute calls, so the alarm survives a licence change.
Graph consumption by integration if you can attribute it. The conversation about which team is burning the allowance goes very differently when there is a chart.
Getting the metrics in without a bill shock
You can call PutMetricData directly, and it works, and it is a synchronous API call in the hot path of your job that can fail or add latency. Custom metrics are also charged per metric per month, and a metric is every unique combination of name and dimensions, so a dimension with high cardinality gets expensive quietly.
The better default is Embedded Metric Format: write structured JSON to stdout and CloudWatch extracts the metrics from your logs. No API call, no added latency, and the log line stays queryable in Logs Insights alongside the metric.
{
  "_aws": {
    "Timestamp": 1700000000000,
    "CloudWatchMetrics": [{
      "Namespace": "SalesforceSync",
      "Dimensions": [["Integration"]],
      "Metrics": [
        { "Name": "RunCompleted",     "Unit": "Count"   },
        { "Name": "RecordsWritten",   "Unit": "Count"   },
        { "Name": "SourceLagSeconds", "Unit": "Seconds" },
        { "Name": "ApiUsagePercent",  "Unit": "Percent" }
      ]
    }]
  },
  "Integration": "opportunity-sync",
  "RunId": "a41c9f",
  "RunCompleted": 1,
  "RecordsWritten": 4127,
  "SourceLagSeconds": 312,
  "ApiUsagePercent": 8.1
}
Note what is a dimension and what is not. Integration is a dimension because it has a handful of values and you want to alarm per integration. RunId is a plain field: searchable in the logs, and not a dimension, because making it one would create a new metric on every run. That distinction is the whole cost story.
Grafana on top
CloudWatch dashboards are fine and Grafana is better for this, for three reasons: you can put Salesforce metrics next to your warehouse and application metrics on one screen, the alerting is more expressive, and non-engineers will actually open it.
Add CloudWatch as a data source using an IAM role rather than access keys, scoped to cloudwatch:GetMetricData, cloudwatch:ListMetrics and the Logs Insights permissions if you want log panels. One honest cost note: Grafana queries CloudWatch through the metric data API, which is billed per metric requested, so a busy dashboard on a short refresh interval is a real line item. Set a sane refresh, avoid auto-refresh on wall displays, and use the caching in Grafana’s CloudWatch data source.
What goes on the dashboard, in order down the page:
- Freshness per integration, as a stat panel with thresholds. This is the panel people look at.
- Time since last successful run, per integration.
- Records processed, over a window long enough to show the weekly shape.
- API allowance consumed, as a percentage with a threshold line.
- Errors and duration, at the bottom, where they belong.
One dashboard, one screen, no scrolling. A dashboard nobody can read at a glance during an incident is decoration.
Alerts people don’t ignore
Decide deliberately where alerting lives. CloudWatch alarms are more reliable, because they keep working when Grafana is down, and Grafana alerts are more flexible and can span data sources. My default is CloudWatch for the small number of alerts that page someone, and Grafana for everything informational.
Three things that separate a useful alert from noise. Alarm on the symptom, not the cause: “Opportunity data is more than two hours stale” is actionable in a way “Lambda errors greater than zero” is not. Put the runbook link in the alarm description, since that field ends up in the notification and is the only documentation anybody reads at midnight. And use composite alarms to suppress the cascade, so a Salesforce outage produces one page rather than nine.
Common mistakes
- Monitoring only errors, so a stopped job looks identical to a healthy one.
- Leaving
TreatMissingDataat its default on a heartbeat alarm. - Setting it to
breachingand assuming that is sufficient, without handling the evaluation range. - Never testing that an alarm fires by actually breaking something.
- No freshness metric, so nobody can answer how far behind the data is.
- Ignoring API allowance until an integration you do not own breaks.
- High-cardinality dimensions such as record ID or run ID, and the bill that follows.
- Calling
PutMetricDatasynchronously in the job’s critical path. - Alerting on causes rather than on user-visible symptoms.
- A dashboard that requires scrolling and interpretation during an incident.
Best practices
- Emit liveness, volume, freshness and API budget from every integration, as a standard.
- Heartbeat alarms with
breachingplusFILL(), and a window longer than the schedule. - Freshness as the headline metric, because it maps to a question the business asks.
- Embedded Metric Format rather than direct API calls.
- Low-cardinality dimensions; everything else stays a log field.
- Alarm on percentage of the API allowance, not absolute calls.
- IAM roles for the Grafana data source, and a refresh interval you have costed.
- Runbook links in alarm descriptions.
- Composite alarms to collapse cascades into one page.
- A quarterly test that breaks each integration on purpose and confirms someone gets told.
FAQ
Why didn’t my CloudWatch alarm fire when the job stopped?
Almost certainly TreatMissingData. The default sends the alarm to INSUFFICIENT_DATA, which is not ALARM and pages nobody. Set it to breaching, and wrap the metric in FILL() so there is no missing data for CloudWatch to reinterpret.
What’s the single most useful metric to add?
Freshness: how old the newest record on the destination side is. It catches stopped jobs, empty runs, stuck retries and silent filtering with one number, and it is the only one of these metrics a non-engineer can interpret.
CloudWatch dashboards or Grafana?
Grafana if you already run it, because you can put Salesforce, warehouse and application metrics on one screen. CloudWatch if you do not, because a second system to operate is not free. Either way keep the paging alarms in CloudWatch so they survive Grafana being down.
Will custom metrics be expensive?
Only if you make them so. Cost scales with unique name-and-dimension combinations, so a handful of metrics dimensioned by integration name is negligible. Adding a run ID or record ID as a dimension is how the bill grows without anyone noticing.
How do I monitor a third-party connector I can’t add code to?
Monitor the destination instead. A scheduled job that queries the target for the newest record’s timestamp and emits it as a freshness metric works regardless of what wrote the data, and it is arguably a better test because it measures the outcome rather than the process.
The one thing to remember
Absence of failure is not evidence of success. An integration that stopped produces exactly the same error graph as one working perfectly, and every default in your monitoring stack is tuned to stay quiet when data stops arriving rather than to shout about it.
So measure the thing you actually care about. Not “did it error” but “how stale is the data right now”, alarmed in a way that fires on silence, and tested by deliberately breaking it. Everything else on the dashboard is supporting evidence.
Want this built properly?
Integration monitoring tends to get added after the first silent failure, which is one failure too late. Work I take on:
- Instrumenting Salesforce integrations with liveness, volume, freshness and API budget metrics via CloudWatch.
- Auditing existing alarms for the ones that cannot fire, and fixing the missing-data handling.
- Building the Grafana dashboard and data source, including cost-aware query and refresh configuration.
- Alert design: symptom-based alarms, composite alarms to suppress cascades, runbooks attached where people will read them.
- API allowance monitoring and attribution across multiple integrations sharing one org.
- Running a failure drill so you know the alerting works before you need it.
Tell me how you would currently find out that a sync stopped, and I will tell you how long it would take.