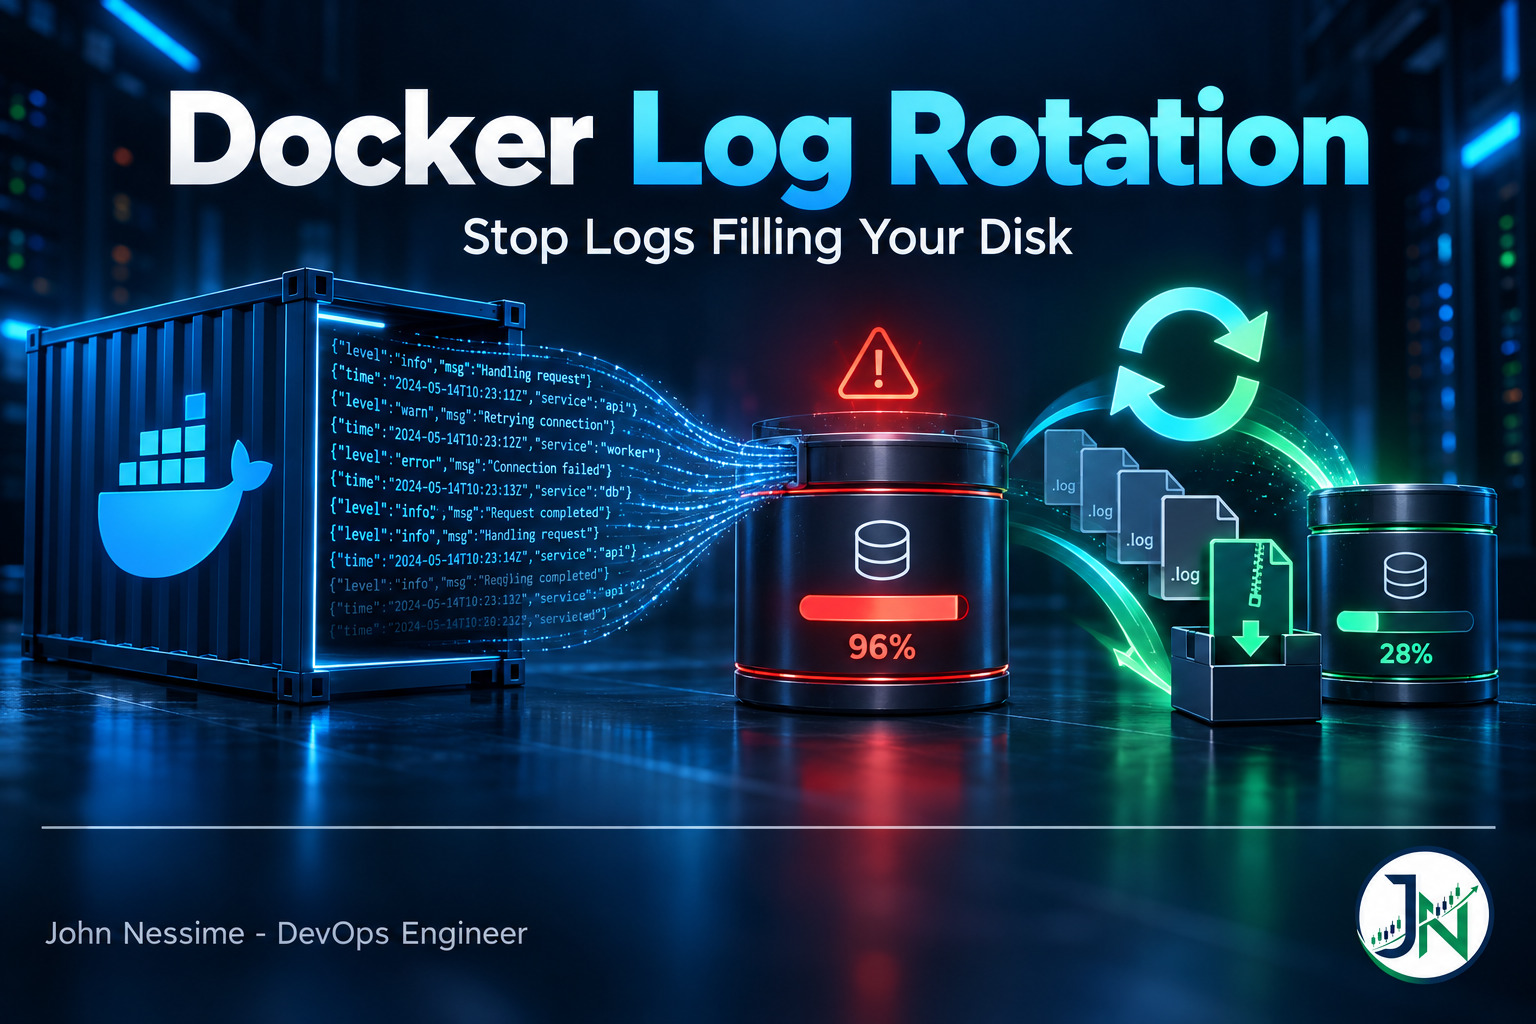
Monitoring says the API is healthy. The ticket says nobody can deploy. You SSH in, run df -h, and the root filesystem is at 100%. A few minutes of poking around /var/lib/docker later you find it: one container, one file, a double-digit number of gigabytes of newline-delimited JSON, written continuously since the day that container was created.
Nothing was broken. That is the part people get stuck on. The container did exactly what it was told, the daemon did exactly what it was told, and the disk filled anyway. Docker’s default logging driver has no size cap and no rotation, and it has been that way for a long time on purpose.
This post covers Docker log rotation properly: what the defaults actually do, why the daemon.json change you already made did nothing, why deleting the log file did not give you your disk back, how the available drivers differ in the ways that matter under load, and what to do when you need space in the next sixty seconds.
The default is unbounded, and that is documented behaviour
Docker’s default logging driver is json-file. It captures stdout and stderr from the container’s main process and appends one JSON object per line to a file on the host, one file per container. Each line carries the message, whether it came from stdout or stderr, and a timestamp.
The important part is the option defaults. For json-file, max-size defaults to unlimited, max-file defaults to 1, and compress defaults to false. Put together, that means: one file, no rotation, grows until something else breaks.
Docker’s own documentation is upfront about why. Keeping json-file unrotated by default preserves backwards compatibility with older engines and suits situations where Docker is acting as a runtime under Kubernetes, where the kubelet handles rotation itself. It is a deliberate choice that happens to be the wrong one for almost every standalone host.
Before you change anything, find out what you actually have. These three commands answer different questions and you want all three:
# What driver is the daemon handing to newly created containers?
docker info --format '{{.LoggingDriver}}'

# What is this specific container actually using right now?
docker inspect --format '{{.HostConfig.LogConfig}}' my-api

# Where does its log live, and how big has it got?
docker inspect --format '{{.LogPath}}' my-api
sudo du -h "$(docker inspect --format '{{.LogPath}}' my-api)"
The gap between the first command and the second is where most of the pain lives, and we will come back to it.
To find the offenders across the whole host, look at the per-container directories under the Docker data root. Each one holds that container’s log file plus a small amount of metadata, so the sizes are close enough to be useful:
sudo du -sh /var/lib/docker/containers/* | sort -rh | head -10Container IDs are not memorable, so map the winner back to a name with docker ps --no-trunc or by grepping the ID against docker ps -aq. In my experience the top entry is almost never the application you were worried about. It is usually a reverse proxy logging every request, a health-check loop firing every few seconds, or a debug flag somebody set during an incident and never turned off.
Setting up Docker log rotation on the daemon
The daemon-wide fix goes in /etc/docker/daemon.json. If the file does not exist, create it. If it does, merge these keys in rather than overwriting it, because that file often already carries storage driver, address pool or registry mirror settings you do not want to lose.
{
  "log-driver": "json-file",
  "log-opts": {
    "max-size": "10m",
    "max-file": "3",
    "compress": "true"
  }
}
What each key buys you:
max-sizecaps a single file. Accepts an integer plusk,morg. This is the setting that stops the runaway.max-filecaps how many files are kept. When rotation would create one too many, the oldest is deleted. It is only effective ifmax-sizeis also set, which is the single most common misconfiguration I see.compressgzips rotated files. The active file stays uncompressed so it can still be appended to and read. Log text compresses extremely well, so this is close to free retention.
Two things trip people up here. First, every value in log-opts must be a JSON string, including the numeric ones. Writing "max-file": 3 without quotes is invalid and the daemon will refuse to start cleanly. Second, validate before you restart, because a malformed daemon.json on a production host is a much worse afternoon than a full disk:
# Confirm the file is valid JSON before touching the daemon
sudo python3 -c 'import json,sys; json.load(open("/etc/docker/daemon.json"))'
  && echo "daemon.json parses OK"

sudo systemctl restart docker
Now do the arithmetic, because this is a budget and not a magic switch. Worst case per container is max-size multiplied by max-file. At 10m and 3, that is roughly 30 MB uncompressed per container, less once compression kicks in on the rotated files. Multiply by your container count and compare against the disk. On a small VPS plan from a provider like InterServer or Hetzner, where the whole root volume might be 20 to 40 GB shared with images and volumes, forty containers at 30 MB each is a real slice of your budget rather than a rounding error.
Why your daemon.json change did nothing
This is the failure mode that costs the most time, because it looks exactly like the fix not working.
Logging configuration is baked into a container’s host config when the container is created. Restarting the daemon does not rewrite it. Restarting the container does not rewrite it either, because docker restart stops and starts the same container object rather than making a new one. Your new limits apply to containers created after the daemon restart and to nothing else.
So the container that filled your disk keeps filling your disk, its log file still has no cap, and docker info cheerfully reports the new defaults. That mismatch is exactly what the second command in the earlier block is for.
To actually apply it, recreate the container and then verify rather than assuming:
# Compose: recreate the service so it picks up the new daemon defaults
docker compose up -d --force-recreate web

# Verify the container is really carrying the limits
docker inspect --format '{{.HostConfig.LogConfig}}' web
You want to see the driver name followed by the map of options. An empty map means the container is still unbounded no matter what the daemon says.
Note that recreating a container discards its existing log history along with the old container. If those logs matter for an ongoing investigation, copy them off first.
Pinning limits per service in Compose
Daemon defaults are a floor, not a policy. A chatty ingress proxy and a quiet cron worker do not deserve the same budget, and per-service configuration in Compose overrides daemon.json entirely. A YAML anchor keeps it from turning into copy-paste sprawl:
x-logging: &default-logging
  driver: json-file
  options:
    max-size: "10m"
    max-file: "3"
    compress: "true"

services:
  web:
    image: nginx:alpine
    logging: *default-logging

  worker:
    image: myorg/worker:latest
    logging:
      driver: json-file
      options:
        max-size: "50m"
        max-file: "3"
        compress: "true"
Be aware that the logging block replaces the daemon config rather than merging with it. If you specify a driver and forget the options, you get that driver with its defaults, which for json-file means straight back to unbounded. Half-specifying is worse than not specifying at all.
You deleted the log file and df did not move
Classic 3am mistake, and it is worth understanding rather than memorising.
When you rm the JSON log of a running container, you remove the directory entry. You do not remove the inode, because the Docker daemon still holds an open file descriptor pointing at it. The kernel keeps the data allocated until the last descriptor closes. So the file disappears from ls, the daemon keeps writing into a file you can no longer see, and df reports exactly the same usage as before. Space comes back only when you restart the daemon or recreate the container.
truncate -s 0 is the right tool. It zeroes the file in place without unlinking it, so the descriptor stays valid, the daemon keeps appending to the same inode, and the blocks are released immediately:
sudo truncate -s 0 "$(docker inspect --format '{{.LogPath}}' my-api)"There is a cost. Truncating out from under the daemon can leave an in-flight docker logs -f stream reading from an offset that no longer exists, so the follow appears to hang with no new output until you reattach. It is a known behaviour rather than corruption, and reattaching clears it. Live with it during an incident, but do not build it into a cron job.
The same reasoning applies to logrotate rules pointed at /var/lib/docker/containers/*/*.log. Rotating with copytruncate works mechanically, but you are reaching into files the daemon considers its own, and you inherit the follow-stream issue on every rotation cycle. Docker’s own docs warn against external tools touching those files. If the driver can rotate for you, let it.
Choosing a driver, and what each one costs
json-file
The default. Widest tooling compatibility, since every log shipper and every scraper knows this format. docker logs works natively. Its genuine downside is the format itself: JSON per line is verbose, so you pay in disk and in parse cost on read. Reach for it when something downstream reads those files directly.
local
Docker’s recommendation for standalone hosts, and the one I reach for first. It uses a more efficient on-disk format, and critically it rotates and compresses by default, retaining five files of 20 MB each per container out of the box. docker logs works exactly as normal. The trade-off is that the format is Docker’s own, so third-party agents that expect to tail JSON files cannot read it directly. If your entire log path is docker logs plus a shipper that talks to the daemon, this is the safest default you can pick.
journald
Hands container output to systemd’s journal, which means you get journalctl filtering, structured fields, and the journal’s own size management via SystemMaxUse in journald.conf. This is a good fit on hosts where you already read system logs that way and want one retention policy instead of two.
The catch nobody mentions: the journal has rate limiting on by default. A container in a crash loop can trip it, and messages get dropped with a note saying how many were suppressed. That is fine for noise and terrible for the incident you are actually debugging. If you go this route, look at RateLimitIntervalSec and RateLimitBurst before you need them, not after.
syslog, fluentd and the remote drivers
These push logs off the box to rsyslog, Fluentd, Loki, or a hosted platform. Disk pressure genuinely goes away because the host stops being the system of record. That is the right destination for anything beyond a handful of hosts.
What you buy with it is a dependency. Your logging path now has a network hop, and the failure modes of that hop become your failure modes. Whether it is self-hosted Grafana Loki, or a managed service like Grafana Cloud, Better Stack or Datadog, the operational question is the same: what happens to the container when the collector is unreachable? Answer that during setup rather than during an outage.
none
Discards output entirely. Legitimate for a container that already writes its own logs to a mounted volume, and a trap everywhere else, because docker logs returns nothing and you will waste twenty minutes concluding the container is broken.
The blocking behaviour worth knowing about
By default the logging path is blocking. If the driver cannot keep up, the container’s write to stdout blocks, which means your application stalls. On a local file that is rarely an issue. Pointed at a remote collector that has gone slow, it means a logging problem becomes an application latency problem.
docker run -it
  --log-opt mode=non-blocking
  --log-opt max-buffer-size=4m
  alpine ping 127.0.0.1
Non-blocking mode buffers in memory and drops messages once the buffer is full rather than stalling the writer. The default buffer is 1 MB. You are choosing which failure you prefer: a slow application, or missing log lines exactly when things are going wrong. There is no answer that is right everywhere, but for a user-facing service I would rather lose lines than add latency.
Dual logging, and why docker logs still works
If you switch to a remote driver and find docker logs still returns output, that is dual logging. When the configured driver cannot serve reads, the engine keeps a local cache using the local driver so the command still works. That cache rotates by default, limited to five files of 20 MB each per container before compression.
Useful to know for two reasons. It explains why disk usage does not drop to zero after you move logging off the box. And it means the local cache has its own retention that you can tune or disable separately from the driver you configured.
Reclaiming space when the disk is already full
Order matters here. Free space first, fix the cause second, verify third.
- Confirm logs are actually the problem. Compare
du -sh /var/lib/docker/containersagainstdocker system df, which reports images, volumes and build cache. Images are often the real culprit and truncating logs will not help you. - Identify the largest log files with the
duandsortcommand from earlier. - Copy anything you need out first, if the logs are part of an active investigation.
- Truncate the offenders with
truncate -s 0. Neverrm. - Set the limits in
daemon.json, validate the JSON, restart the daemon. - Recreate the containers so the limits take effect, then confirm with
docker inspecton each one. - Add a disk alert. A full disk should never be discovered by a human noticing something else is broken.
Step seven is the one that actually stops this recurring. Rotation caps the damage, but a container that suddenly starts logging a hundred times more than usual is telling you something, and a disk-usage alert on the Docker data root is how you hear it.
Troubleshooting
Rotation is configured but files still grow past the cap. The container predates the change. Check docker inspect --format '{{.HostConfig.LogConfig}}' and recreate it.
The daemon will not start after editing daemon.json. Almost always invalid JSON, or unquoted values in log-opts. Read the actual error with journalctl -u docker --no-pager -n 50 rather than guessing.
max-file is set but only one file ever appears. max-file does nothing without max-size. Set both.
docker logs -f hangs after showing existing output. Something truncated the file underneath the daemon, usually an external logrotate rule. Reattach to recover, then remove the rule.
docker logs returns nothing at all. Check the driver. none discards everything, and some remote drivers only serve reads through the dual-logging cache.
Disk usage did not drop after deleting log files. The daemon still holds the descriptors. Restart the daemon to release the inodes, and use truncate next time.
Logs vanish sooner than the retention you configured. On journald, check journal rate limiting and SystemMaxUse. On a remote driver in non-blocking mode, check whether the buffer is overflowing.
Common mistakes
- Assuming a daemon restart applies the new limits to running containers. It does not.
- Setting
max-filewithoutmax-sizeand believing rotation is on. - Writing numeric values unquoted in
log-opts. - Overwriting an existing
daemon.jsoninstead of merging, and silently dropping storage or network settings. - Using
rmon a live container’s log file and concluding the disk report is broken. - Specifying a
logging.driverin Compose without itsoptions, which resets that service back to the driver’s own unbounded defaults. - Pointing host
logrotateat the Docker containers directory when the driver could have handled it. - Sizing rotation per container without multiplying by container count against the actual disk.
Best practices
- Set logging limits in
daemon.jsonas part of host provisioning, before any container exists. This belongs in your Ansible role or cloud-init, not in a runbook. - Prefer the
localdriver on standalone hosts unless something specifically needs to read the JSON files. - Turn on
compress. Log text compresses well enough that you get more retention for the same disk. - Size per service rather than uniformly. Give the noisy proxy a tight cap and the service you actually debug a generous one.
- Do the multiplication. Worst-case host usage is
max-size×max-file× container count, and it should be a fraction of your disk, not most of it. - Alert on Docker data root usage at a threshold that leaves you time to act.
- Treat on-host logs as a short buffer, not an archive. Anything you need next quarter belongs in a log platform, not on the VPS.
- Verify with
docker inspectafter any change.docker infotells you the daemon’s intent, not what your containers carry.
Frequently asked questions
Does Docker rotate container logs automatically?
Not with the default driver. json-file ships with max-size unlimited and max-file set to 1, so a single file grows without bound. The local driver does rotate and compress by default. If you have not explicitly configured Docker log rotation, assume it is off.
Where are Docker container logs stored on the host?
Under the Docker data root, one directory per container, which on a standard Linux install means /var/lib/docker/containers/. Rather than assembling the path by hand, ask the daemon: docker inspect --format '{{.LogPath}}' <container>. That works regardless of a custom data-root.
How do I clear Docker logs without stopping the container?
Truncate the file to zero bytes with truncate -s 0 on the path from {{.LogPath}}. Do not use rm: the daemon holds an open descriptor, so deleting the directory entry leaves the data allocated and frees no space until the daemon restarts.
Why did my daemon.json rotation settings not apply?
Because logging config is fixed at container creation time. A daemon restart changes what new containers get; it does not rewrite existing ones, and docker restart reuses the same container object. Recreate the container, then confirm with docker inspect --format '{{.HostConfig.LogConfig}}'.
Should I use the local driver or json-file?
Use local if nothing outside Docker reads the log files directly, since it rotates and compresses by default and uses less disk for the same content. Use json-file if an agent or shipper on the host tails those files, because it cannot parse the local format. Either way docker logs behaves the same.
Can I use logrotate for Docker container logs instead?
You can, and plenty of hosts do, but the driver options are the better tool. A copytruncate rule pointed at the containers directory reaches into files the daemon treats as private, and can leave docker logs -f streams stalled after each rotation. Use logrotate for logs your applications write to mounted volumes, and let the driver handle stdout.
How much disk should I budget for container logs?
Worst case is max-size × max-file per container, multiplied by how many containers run on the host. At 10m and 3 files across thirty containers that is roughly 900 MB before compression. Pick numbers that leave the total at a comfortable fraction of the disk, and keep long-term retention off the box.
The one thing worth remembering
Docker log rotation is not a feature you turn on once at the daemon and forget. It is a property each container carries from the moment it is created, and every container that existed before your change is still running under the old rules.
So the working sequence is always the same: set the limits, restart the daemon, recreate the containers, then verify with docker inspect rather than trusting docker info. Add a disk alert on the Docker data root so the next surprise arrives as a notification and not as a failed deploy. Everything else in this post is detail around that.
Need a hand with container logging on your hosts?
Log sprawl is one of those problems that is cheap to fix in an hour and expensive to leave alone. If you would rather have someone go through it with you, this is the kind of work I take on:
- Auditing every container on a host for logging driver and retention, and producing the recreate plan that actually applies the limits
- Sizing a rotation budget against your real disk, container count and log volume, per service rather than one flat number
- Emergency recovery on a full Docker host, including the cases where deleting files did not give the space back
- Choosing between
json-file,local,journaldand shipping off-box, including the blocking behaviour trade-offs under load - Setting up centralised logging with Loki, rsyslog or a hosted platform, with sane retention on both ends
- Baking logging limits into provisioning so new hosts are never born unbounded, plus the disk alerts to catch what rotation cannot
If you want a second opinion, send me your daemon.json, the output of docker ps and a du -sh of your containers directory, and I will tell you what I would change.