The rollout goes green. kubectl rollout status exits zero, every pod reports 1/1 Running, and the deploy channel gets the thumbs-up emoji. Then someone from support pastes a screenshot: a spike of 502s, about forty seconds wide, lined up exactly with the deploy. Nobody paged. Nothing restarted. The graph just has a small cliff in it.
That gap is the one that costs you, because it is invisible from the control plane. Kubernetes did exactly what you asked. The problem is that a readiness probe only answers one of the four questions that Kubernetes zero-downtime rollouts depend on, and it is not the question that usually bites.
This post walks through the four failure families in the order they usually show up: traffic arriving too early, traffic arriving too late, capacity disappearing faster than it is replaced, and the load balancer that was never watching your endpoints at all. Each one has a different fix, and stacking all four is what actually gets you a clean deploy.
What a zero-downtime rollout actually requires
Three independent things have to be true at the same time, and each is owned by a different part of the system.
- Capacity never dips below what traffic needs. Owned by the Deployment’s rolling update strategy.
- No pod receives traffic before it can serve it. Owned by the readiness probe.
- No pod receives traffic after it stops serving it. Owned by graceful termination, and this is the one nobody configures.
Miss any one and you get errors. Miss the third and you get errors that look like an application bug, because the pod that failed the request no longer exists by the time you go looking for it.
Failure family one: traffic arrives before the pod can serve it
This is the well-documented one. With no readiness probe, a pod is considered Ready as soon as its containers are running, which for most runtimes means “the process was forked”, not “the process can answer HTTP”. The pod lands in the Service’s EndpointSlice, kube-proxy programs it, and requests start arriving while the app is still loading config, warming a connection pool, or compiling templates.
The readiness probe that lies
Adding a probe is easy. Adding one that means something is the part people skip. Two patterns cause trouble:
A readiness endpoint that returns 200 from a static handler. If /healthz is wired up before the rest of the app is, the probe passes while the service is still useless. The readiness endpoint should be the last thing your app enables, after migrations have run, caches are primed and the pool has connected.
A readiness endpoint that checks downstream dependencies. This one feels correct and is actively dangerous. If your readiness check pings the database, then a five-second database blip marks every replica unready simultaneously. The Service loses all its endpoints, traffic has nowhere to go, and a brief degradation becomes a full outage. Readiness answers “can this pod serve traffic”, not “is the whole system healthy”. Check the dependency in your app’s request path and return a sensible error, or expose it on a separate diagnostic endpoint that nothing routes on.
Let the startup probe own the boot budget
For anything slow to boot, do not stretch initialDelaySeconds on the readiness probe until it covers the worst case. That delay applies on every restart forever, and it makes recovery slower than it needs to be. Use a startup probe instead: while it is running, liveness and readiness probes are suppressed entirely, and once it succeeds the fast probes take over.
# The startup probe owns the boot window. failureThreshold x periodSeconds
# is the total budget: 30 x 5 = 150 seconds before the kubelet gives up.
startupProbe:
  httpGet:
    path: /healthz/started
    port: http
  periodSeconds: 5
  failureThreshold: 30

# Readiness is fast and cheap. Two consecutive failures pull the pod out
# of rotation within about 6 seconds.
readinessProbe:
  httpGet:
    path: /healthz/ready
    port: http
  periodSeconds: 3
  timeoutSeconds: 2
  failureThreshold: 2

# Liveness is deliberately slower and points at a DIFFERENT endpoint.
# This one restarts the container, so it should only fire on real deadlock.
livenessProbe:
  httpGet:
    path: /healthz/live
    port: http
  periodSeconds: 10
  timeoutSeconds: 2
  failureThreshold: 3
Pointing liveness and readiness at the same URL is a common and expensive mistake. Under load, a slow response fails both: readiness pulls the pod out of rotation, which is right, and liveness kills the container, which is wrong. You lose the pod entirely instead of letting it recover, and the remaining replicas absorb its traffic, get slower, and fail their own liveness checks. That is how a latency spike turns into a rolling restart of the whole Deployment.
Failure family two: traffic arrives after the pod has stopped
This is the invisible one, and in my experience it accounts for most of the leftover errors after someone has “already added readiness probes”.
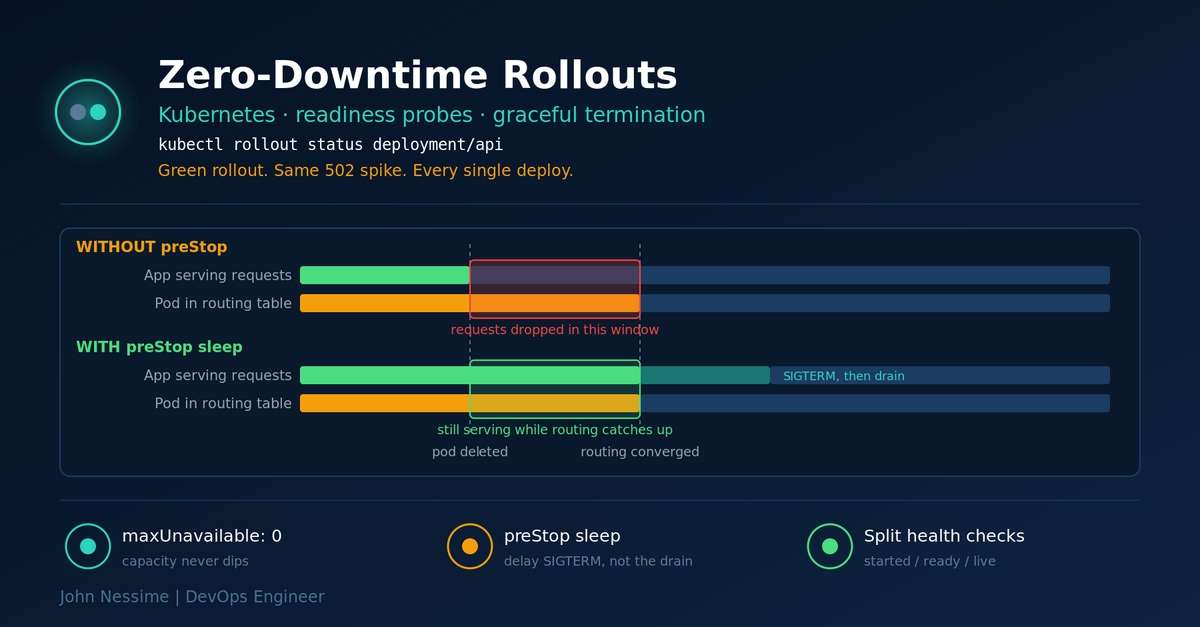
When a pod is deleted, two things happen in parallel, not in sequence:
- The kubelet begins the shutdown sequence: run the preStop hook if one exists, then send SIGTERM to the container’s main process.
- The endpoints controller marks the pod as terminating in its EndpointSlice, and every consumer of that data has to notice and reprogram: kube-proxy on every node, your ingress controller, your service mesh sidecars, and any cloud load balancer with its own target registry.
Nothing coordinates those two tracks. Kubernetes offers no guarantee that routing has converged before your process gets SIGTERM. On a small cluster the gap might be under a second. On a busy cluster with a few hundred nodes and an ingress controller reconciling on its own schedule, it can be several seconds. Every request that lands in that window hits a socket that is closing or already closed, and your users see a 502 or a connection reset.
The preStop sleep, and what it does not do
The fix is to delay SIGTERM so the routing fabric gets a head start. A preStop hook must finish before the TERM signal is sent, so sleeping in it does exactly that.
spec:
  # Total budget for preStop + graceful shutdown. Default is 30.
  terminationGracePeriodSeconds: 60
  containers:
    - name: api
      lifecycle:
        preStop:
          # Native handler, run by the kubelet. No shell needed in the image,
          # which matters for distroless and scratch-based builds.
          sleep:
            seconds: 15
If you are on an older cluster without the native sleep handler, the equivalent is an exec hook, which does require a shell and a sleep binary in the image:
lifecycle:
  preStop:
    exec:
      command: ["/bin/sh", "-c", "sleep 15"]
Be clear about what this buys you. The sleep does not drain anything. Your application keeps serving normally during it, unaware anything is happening. All it does is push SIGTERM later, so that by the time your process starts shutting down, nothing is sending it new work. Draining in-flight requests is still your application’s job, on receipt of SIGTERM: stop accepting new connections, finish what is open, then exit.
There is no universally correct sleep value, and anyone who gives you one is guessing. Measure it in your own cluster, on a normal weekday, and add margin.
The grace period is a shared budget
This trips people up. The terminationGracePeriodSeconds countdown starts when the pod is marked Terminating, which is before the preStop hook runs, not after. The hook and your application’s shutdown both spend from the same clock. If the grace period is 30, the hook sleeps 25, and your app needs 10 seconds to drain, the app gets SIGKILLed mid-drain and you have made things worse.
Size it as: preStop sleep + your longest realistic request + a few seconds of slack. And if your app holds long-lived connections such as WebSockets, gRPC streams or server-sent events, remember that removing an endpoint does nothing to connections that are already established. Either the grace period has to be long enough to see them out, or the client needs to reconnect on its own.
One more detail worth knowing before you go looking for it: probes accept their own terminationGracePeriodSeconds override, but only liveness and startup probes. You cannot set it on a readiness probe, because a failing readiness probe never kills anything.
Failure family three: the rollout deletes capacity faster than it adds it
The default rolling update strategy allows 25% of your pods to be unavailable during the update. On a Deployment with four replicas, that is one pod gone before its replacement is ready. If you are running near capacity, losing 25% of your fleet mid-deploy means queueing, timeouts and retries, none of which show up as a failed rollout.
apiVersion: apps/v1
kind: Deployment
metadata:
  name: api
spec:
  replicas: 4
  # Rollout has 10 minutes to finish before it is marked failed.
  progressDeadlineSeconds: 600
  # A new pod must stay Ready this long before it counts. Catches pods
  # that pass the probe and then immediately crash.
  minReadySeconds: 15
  revisionHistoryLimit: 10
  strategy:
    type: RollingUpdate
    rollingUpdate:
      # Never drop below the declared replica count.
      maxUnavailable: 0
      # Allow one extra pod on top while rolling.
      maxSurge: 1
Setting maxUnavailable: 0 is the right default for anything user-facing. The trade-off is real and worth stating: you now need headroom for one extra pod, and the rollout is slower because it is strictly sequential, waiting for each new pod to become Ready before removing an old one. On a Deployment with thirty replicas and a slow start-up, that can turn a two-minute deploy into fifteen. Raise maxSurge to a percentage if you have the node capacity and want the speed back.
minReadySeconds is the underrated one. Without it, a pod that passes its readiness probe and then falls over two seconds later still counts as a successful step, and the rollout marches on, replacing healthy pods with broken ones until the whole Deployment is bad. A short hold turns that into a stalled rollout you can catch, which is exactly what you want.
Rollouts are not the only thing that replaces pods, either. Node drains during a cluster upgrade evict pods too, and they respect PodDisruptionBudgets rather than your rolling update strategy. If you tuned one and not the other, an upgrade on a self-managed cluster, whether on cloud instances or your own VPS nodes from a provider like InterServer or Hetzner, will happily take out more replicas at once than any deploy ever did.
apiVersion: policy/v1
kind: PodDisruptionBudget
metadata:
  name: api
spec:
  # Keep at least three replicas up during voluntary disruptions.
  minAvailable: 3
  selector:
    matchLabels:
      app: api
Failure family four: the load balancer was never watching EndpointSlices
Everything above assumes traffic reaches your pods through a Service, where endpoint removal is the whole story. Plenty of production setups do not work that way.
Cloud load balancers that target pod IPs directly keep their own target registry. When a pod terminates, a controller has to call the cloud API to deregister it, that call has to be accepted, and the load balancer has to propagate the change to its own data plane. Then a configurable deregistration delay runs before the target is fully removed. That chain is slower and more variable than kube-proxy, often by an order of magnitude, and it explains why teams on managed clusters sometimes report that a preStop sleep of five seconds fixed nothing.
Two things help here:
- Pod readiness gates. These let an external controller add a condition to the pod that must be true before the pod counts as Ready. With a load balancer controller that supports them, a new pod is not considered Ready until the load balancer has actually registered it and passed its own health check. That closes the mirror image of the termination race, on the way in.
- Match your preStop sleep to the deregistration delay. If your target group is configured to drain for 30 seconds, a 5-second sleep is not enough. The sleep needs to cover the time until the load balancer genuinely stops sending new connections.
The same reasoning applies to an ingress controller running in the cluster. Ingress-NGINX, Traefik and friends watch EndpointSlices and reload their own config, which is fast but not instant, and each has its own graceful shutdown settings that need to be consistent with the pod’s grace period. If your edge sits behind Cloudflare or another CDN, be aware that it may retry an idempotent request against another origin, which quietly hides some of these errors from your users while leaving them in your logs. That is a good safety net, not a substitute for fixing the race.
Verifying a zero-downtime rollout instead of hoping
A rollout that has never been tested under load is a rollout you have not tested. The whole point of these failure modes is that they only appear when requests are in flight.
- Generate steady traffic against the real ingress path. Not against a pod IP, and not through a port-forward. Those bypass exactly the layers you are trying to test.
- Trigger a rollout with no image change, so you are testing the mechanism rather than your new code.
- Watch EndpointSlices in a second terminal and note how long a terminating pod stays in the list.
- Count non-200 responses. Anything above zero is a bug, not noise.
- Repeat under realistic concurrency. A single-threaded curl loop will miss a 300ms window that a real traffic level would hit hundreds of times.
# Terminal 1: steady probe traffic, printing status and latency
while true; do
  curl -s -o /dev/null -w '%{http_code} %{time_total}n' https://api.example.com/
  sleep 0.2
done

# Terminal 2: watch endpoints appear and disappear in real time
kubectl get endpointslices -l kubernetes.io/service-name=api -w

# Terminal 3: roll the deployment without changing the image,
# then follow progress and stop on a stall
kubectl rollout restart deployment/api
kubectl rollout status deployment/api --timeout=10m
Do this once per service and record the numbers. If you already run Prometheus and Grafana, or a hosted stack like Grafana Cloud or Datadog, put a deploy annotation on your error-rate panel so the correlation is obvious next time instead of something someone has to notice by eye.
Troubleshooting
Rollout hangs, new pods never become Ready. The readiness probe is failing. kubectl describe pod shows the probe failure and the response it got. Check that the port name in the probe matches a declared containerPort name, that the path exists, and that the app is listening on all interfaces rather than only 127.0.0.1, which is a classic one when moving from a local docker-compose setup.
Probes fail only under load. Look at CPU limits before you look at anything else. A container being CPU-throttled cannot answer a probe within timeoutSeconds, and the default timeout is one second. This produces restart storms that look like an application bug and are actually a resource limit.
Errors persist after adding a preStop sleep. Either the sleep is shorter than your routing convergence time, or the load balancer is not driven by EndpointSlices at all. Time it: mark the moment of deletion, then watch how long the endpoint stays listed. Increase the sleep past that number and re-test.
Pods stuck Terminating for the full grace period. Your app is ignoring SIGTERM. This is extremely common when the container’s entrypoint is a shell script, because the shell runs as PID 1 and does not forward signals to the child. Use the exec form of ENTRYPOINT, or an init like tini, so your process actually receives the signal.
Rollout succeeded but the new version is broken. Roll back first, investigate second.
# Freeze a rollout mid-flight without reverting what has already landed
kubectl rollout pause deployment/api
kubectl rollout resume deployment/api

# Inspect revisions, then go back
kubectl rollout history deployment/api
kubectl rollout undo deployment/api --to-revision=3
Common mistakes
- Pointing liveness and readiness at the same endpoint, so a slow response restarts the container instead of just removing it from rotation.
- Checking databases or downstream APIs in the readiness probe, turning a dependency blip into a total outage.
- Leaving
maxUnavailableat the default on a service running near capacity. - Adding a preStop sleep longer than the grace period, so the app gets SIGKILLed before it can drain.
- Running a single replica and expecting a rolling update to be seamless. With one pod there is nothing to roll onto.
- Using RollingUpdate for workloads that cannot tolerate two versions running at once, such as a single-writer process or a schema change that is not backward compatible. Recreate exists for these, and it does mean downtime.
- Testing the deploy with no traffic flowing, which makes every one of these failure modes invisible.
Best practices
- Three separate endpoints:
/healthz/started,/healthz/ready,/healthz/live. They answer different questions and should be allowed to disagree. maxUnavailable: 0plus amaxSurgeyou have node capacity for, as the default for anything user-facing.- A preStop sleep on every pod behind a Service, sized from a measurement rather than a blog post.
- A grace period that covers preStop plus your slowest realistic request, with slack.
- Handle SIGTERM properly in the application, and make sure it reaches PID 1.
- A PodDisruptionBudget on anything that matters, so node drains are as safe as deploys.
minReadySecondslong enough to catch a pod that passes its probe and then dies.- Annotate deploys on your dashboards, and treat any non-200 during a rollout as a defect rather than background noise.
FAQ
Do readiness probes alone give me zero-downtime deployments?
No. A readiness probe stops traffic reaching a pod that is not ready yet. It does nothing about the window between a pod being marked for deletion and the routing layer noticing, and nothing about capacity dipping during the rollout. You need the rolling update strategy and graceful termination as well.
How long should the preStop sleep be?
Long enough for everything that routes traffic to your pods to stop doing so. Measure it: delete a pod, watch the EndpointSlice, and time how long it stays listed. Behind a cloud load balancer, add its deregistration delay on top. Then confirm by running the load test with the value you picked.
Should the readiness probe check the database?
Almost never. It couples the availability of every replica to a single shared dependency, so one slow query can empty your Service of endpoints all at once. Handle dependency failures in the request path and return a meaningful error instead.
What is the difference between maxSurge and maxUnavailable?
maxSurge is how many pods you may run above the replica count during a rollout. maxUnavailable is how many you may drop below it. Surge costs resources; unavailability costs capacity. For zero downtime you want unavailability at zero and surge at whatever your nodes can absorb.
Why do I still get 502s on EKS, GKE or another managed cluster?
Cloud load balancers that target pod IPs maintain their own target registry, and deregistration goes through a cloud API rather than kube-proxy. That path is slower and more variable. Use pod readiness gates if your load balancer controller supports them, and size the preStop sleep against the target group’s deregistration delay rather than against kube-proxy.
Can I get zero-downtime rollouts with a StatefulSet?
The same probe and termination mechanics apply, but StatefulSets update pods one at a time in reverse ordinal order and cannot surge, so there is no extra pod covering the gap. Whether that is zero downtime depends entirely on whether your application tolerates losing one member at a time, which for most quorum-based systems it does and for a single-writer database it does not.
Does kubectl rollout status prove the deploy was clean?
It proves the desired number of pods reached Ready within the progress deadline. It says nothing about requests that failed on the way there. The only thing that proves a clean deploy is traffic flowing through the real ingress path with a zero error count.
The one thing worth remembering
Kubernetes zero-downtime rollouts are not a feature you turn on. They are the result of four separate things being configured correctly at once, and the readiness probe is only the most obvious of them. The one that actually drops requests in most clusters is the race at the other end: your process receives SIGTERM while the routing layer still believes the pod is a valid destination.
Delay the signal, size the grace period to cover the delay plus a real request, and then prove it with traffic flowing. Everything else is bookkeeping.
Need a second pair of eyes on your rollouts?
Most of this work is unglamorous: reading manifests, timing endpoint propagation, and finding the one Deployment that never got a preStop hook. Things I can help with:
- Auditing your Deployments and Helm charts for probe, surge and termination settings, with a prioritised list of what to change
- Measuring real endpoint propagation time in your cluster and sizing preStop and grace periods from that number
- Building a load-test harness that runs against a rollout in CI, so a regression fails the pipeline instead of the pager
- Tracking down 502s and connection resets that only appear during deploys, including cloud load balancer and ingress controller paths
- Splitting a single overloaded health endpoint into proper startup, readiness and liveness checks
- Adding PodDisruptionBudgets and drain-safety so cluster upgrades stop being an event
If you have a Deployment manifest, a kubectl describe pod output, or a graph showing your error rate during a deploy, send it over and I will tell you what I see.