Someone asks why the nightly invoice sync hasn’t posted anything since Tuesday. You open Grafana. The n8n scrape target is UP, the instance has been running for weeks without a restart, every panel is green. Nothing on the dashboard says a thing is wrong, and yet four days of records are missing.
That gap is the entire problem. Monitoring n8n workflow failures in Grafana is not hard because the tooling is missing. It’s hard because the built-in metrics endpoint answers a question you didn’t ask. It tells you the process is alive and busy. It does not tell you that a workflow stopped producing correct output.
This post covers what n8n’s Prometheus endpoint actually exposes, the three families of failure it handles badly, and the specific PromQL and alert rules that close each gap. There’s also a troubleshooting section for the case where /metrics returns nothing at all, which is the first wall most people hit.
What the n8n metrics endpoint actually gives you
n8n uses the prom-client library and serves metrics on the same port as the editor, at /metrics. The endpoint is off by default, and almost everything interesting inside it is off by default too, behind its own environment variable.
N8N_METRICS=true
N8N_METRICS_INCLUDE_MESSAGE_EVENT_BUS_METRICS=true
N8N_METRICS_INCLUDE_WORKFLOW_ID_LABEL=true
N8N_METRICS_INCLUDE_NODE_TYPE_LABEL=true
N8N_METRICS_INCLUDE_QUEUE_METRICS=true
The first line opens the endpoint. The second turns on the workflow and node event counters, which is the part people assume is included and is not. The third attaches a workflow_id label to workflow metrics, without which you get a single instance-wide number and no way to tell which automation broke.
Those labels are opt-in for a reason worth understanding rather than working around. Every distinct label value creates a separate time series. Turn on workflow_id and you get one series per workflow per counter; add node_type and node counters fan out across every integration you use. On a few dozen workflows that’s fine. On several hundred with per-node labels, you’re signing up for a cardinality problem that surfaces later as slow queries and a Prometheus process that keeps getting OOM-killed.
With the event bus metrics enabled, the counters you get include n8n_workflow_started_total, n8n_workflow_success_total, n8n_node_started_total and n8n_node_finished_total. Queue mode adds n8n_scaling_mode_queue_jobs_active, _completed, _failed and _waiting, gathered from Bull and exposed on the main instance only.
Prometheus side, the scrape job is unremarkable:
scrape_configs:
  - job_name: n8n
    static_configs:
      - targets:
          - n8n-main:5678
          - n8n-worker-1:5678
    metrics_path: /metrics
Note both main and workers. Each process exposes its own endpoint and its own counters. Scrape only the main and you lose everything the workers did, which in queue mode is nearly all the real execution work.
One thing the n8n docs are emphatic about, and they’re right: don’t put /metrics on the public internet. It leaks workflow IDs, execution volumes and instance topology to anyone who asks. Keep the scrape path on a private network segment, a WireGuard tunnel, or your provider’s internal networking. If you’re running the whole stack on a single VPS from somewhere like Contabo or InterServer, binding n8n to the Docker network and scraping it by container name is enough. Publishing port 5678 to the host and firewalling it afterwards is not, because you will forget.
Failure family one: the execution that never happened
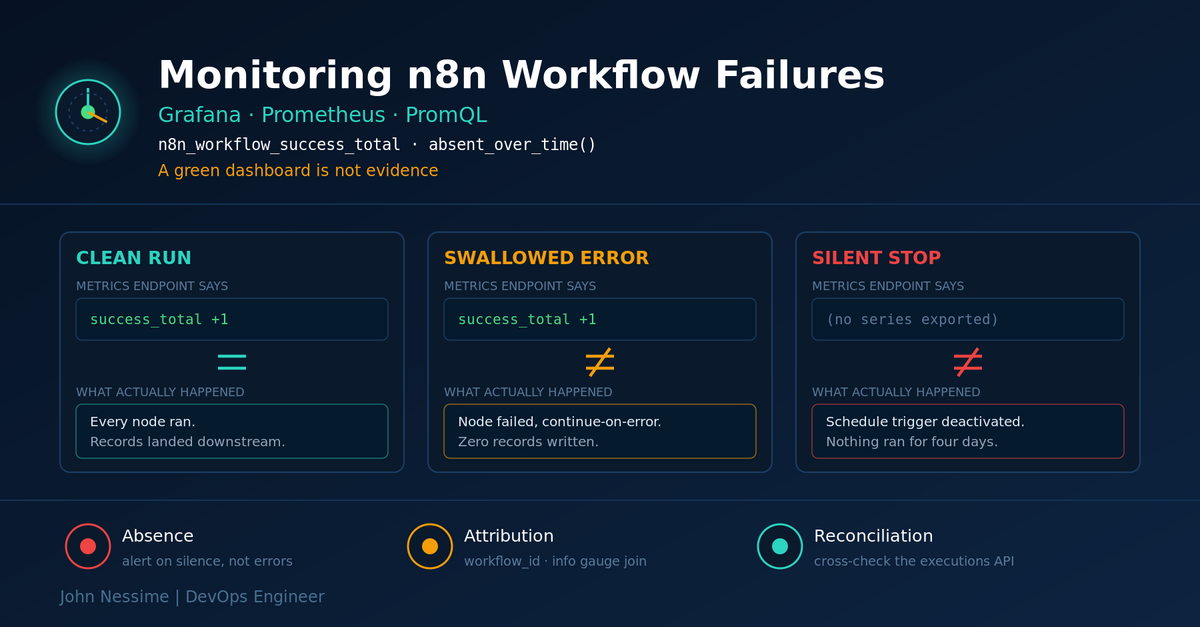
This is the one that costs the most and shows up the least. A schedule trigger gets deactivated during a deploy. A credential expires and the workflow is switched off rather than fixed. An upstream service stops calling a webhook. Nothing errors. Nothing increments. The workflow simply stops existing as far as your metrics are concerned.
Every error-rate alert you write is blind to this, because an error rate needs a denominator. Zero executions divided by zero executions is not an alert, it’s a NaN.
The instinct is to write this:
sum by (workflow_id) (increase(n8n_workflow_started_total[6h])) == 0It looks correct and it does not work. When a workflow stops running, its series stops being exported. Prometheus marks it stale after a few missed scrapes and instant queries stop returning it. There is no series left for == 0 to match against. The alert never fires, because the thing you wanted to alert on is exactly the thing that removed the data.
What you want is a function that returns something when a series is absent:
absent_over_time(
  n8n_workflow_started_total{workflow_id="AbC123XyZ"}[6h]
)
absent_over_time returns 1 if the matched series produced no samples in the window and nothing at all if it did. That inversion is the point. The alert fires on silence.
The cost is that absent_over_time needs an exact matcher, so you can’t write it once for everything. That’s more acceptable than it sounds. You don’t need a heartbeat on all two hundred workflows, you need one on the six a human would notice within an hour. Write those six by hand and treat the list as part of the runbook.
One Grafana-specific trap. When a query returns nothing, Grafana’s alert rule enters a No Data state, which is configurable separately from the alert condition and defaults to firing in most versions. Set it deliberately. For an absent_over_time rule, No Data means the whole scrape target is gone, which is a different incident from one workflow going quiet, and you probably want it routed differently.
Failure family two: the failure you can see but can’t attribute
You have the counters. Something is failing. Which workflow?
Without N8N_METRICS_INCLUDE_WORKFLOW_ID_LABEL, the answer is: no idea. The counters are instance-wide totals. You know the number moved and that’s it. That’s a fine signal for capacity planning and useless during an incident.
Turn the label on and you get IDs, which are opaque strings like AbC123XyZ. A dashboard full of those is technically attributable and practically unreadable at 3am. Newer n8n versions solve this with a gauge that maps IDs to names, enabled with N8N_METRICS_INCLUDE_WORKFLOW_INFO:
n8n_workflow_info{workflow_id="VaQPuPmx9tPpo6BX",workflow_name="Invoice sync"} 1It’s a constant-1 gauge that exists only to be joined against. The pattern is a standard Prometheus vector match:
sum by (workflow_name) (
  rate(n8n_workflow_started_total[5m])
  * on(workflow_id) group_left(workflow_name)
  n8n_workflow_info
)
The multiplication is arithmetically a no-op because the gauge is always 1. Its only job is to carry the workflow_name label across with group_left. Do this once in a Grafana variable or a recording rule rather than in every panel, or you’ll be copy-pasting the join for the rest of your life.
On an older build without the info gauge, the fallback is a hand-maintained relabel config or a Grafana value mapping. Both drift, and the relabel version drifts silently.
Failure family three: the failure that counts as a success
This is the invisible one, and it’s why a green n8n dashboard is not evidence of anything.
n8n gives you several deliberate ways to make a node’s failure not be an execution failure. They’re all reasonable features. Together they mean the success counter and “the automation worked” are different statements.
- Continue on error. A node set to continue passes its error downstream instead of stopping the run. The execution finishes. It finishes as a success.
- Error output branches. A node with a separate error output routes failures to a different path. That path might log and stop. The execution still completes normally.
- Never Error on HTTP responses. The HTTP Request node can be configured to treat any status code as a valid response. A run of 500s from an upstream API becomes a workflow that processed zero useful records, successfully.
- Empty result sets. A query that returns nothing is not an error. A sync that syncs nothing, every night, looks exactly like a sync that has nothing to do.
There are also user reports on the n8n community forum of started and success counters matching even when a node failed outright, in queue mode. I have not reproduced that and I’d treat it as unconfirmed rather than a known behavior. But it’s the right instinct: don’t assume the success counter is a strict complement of failure. Verify it on your own instance before you build alerting on the assumption.
For webhook-triggered workflows, newer n8n versions give you a real answer here. The n8n_webhook_request_duration_seconds histogram carries a status_code label, so you can alert on what the caller actually received rather than on what n8n thought about the run:
sum by (workflow_id) (
  rate(n8n_webhook_request_duration_seconds_count{status_code!~"2.."}[5m])
)
Worth flagging: the n8n documentation shows this example with status_code!="2..", using the equality operator. In PromQL, != compares against a literal string, so that matcher excludes only a status code whose literal value is the three characters 2.., which never occurs. It matches everything, including your 200s. Use !~ for the regex form. Test any label matcher you copy from documentation by running it in Prometheus and checking the series count against what you expect.
Getting a second source of truth
For everything that isn’t a webhook, the metrics endpoint alone won’t close this gap. You need a second signal that reads execution outcomes from n8n’s own store.
The public REST API exposes exactly that. Executions can be filtered by status, and the failed ones are one request away:
curl -s -H "X-N8N-API-KEY: $N8N_API_KEY"
  "https://n8n.example.com/api/v1/executions?status=error&limit=50"
Two ways to get that into Grafana. Write a small exporter that polls the API on a timer and serves its own /metrics, or run a scheduled job that pushes counts to a Prometheus Pushgateway. The exporter is more work and behaves correctly. Pushgateway is faster to build and carries the usual caveat: pushed metrics persist until deleted, so a job that stops running leaves a stale value sitting there looking healthy. That reintroduces failure family one through the back door.
Two caveats on the API. There’s an open report that the status=crashed list filter returns executions whose stored status is something else entirely when re-fetched by ID, which would make crash alerting built on the list endpoint unreliable. Check the behavior on your version before depending on it. And n8n’s log streaming feature, which forwards execution events to syslog or a webhook in real time, is an Enterprise capability. If you’re on the community edition, the API poll is your path.
The third option, and often the best one for a small setup, is an Error Trigger workflow. n8n lets you designate a workflow that runs whenever another workflow fails. Point it at Pushgateway, at Loki, or at a Grafana webhook contact point. It’s native, it needs no API key, and it gives you the error message rather than just a count. The trade-off is that it only fires on real execution failures, so it inherits every blind spot in this section.
The Grafana panels that earn their space
Four panels cover most of what you need. Everything past that is usually decoration.
- Executions per workflow, by name. A time series of
rate(n8n_workflow_started_total[5m])joined ton8n_workflow_info. Its real job is showing you the lines that flatten to zero. - Success ratio.
rate(n8n_workflow_success_total[15m]) / rate(n8n_workflow_started_total[15m]). Anything below 1 is worth a look. Anything above 1 means your window is catching a restart and the counters reset. - Queue depth and failed jobs.
n8n_scaling_mode_queue_jobs_waitingnext toincrease(n8n_scaling_mode_queue_jobs_failed[1h]). A waiting count that climbs and never drains means workers are dead or starved, which looks identical to “no failures” on every other panel. - Webhook non-2xx rate. The query from the previous section. This is the only panel that reports what the outside world experienced.
Skip the node-level breakdown unless you have a specific reason. It is the most expensive thing you can enable in cardinality terms and it answers a question you can answer faster by opening the execution in the n8n UI.
Alert rules worth paging on
- Named workflow silent.
absent_over_timeon each business-critical workflow, window set to roughly twice its expected interval. This is the rule that catches the invoice sync. - Success ratio below threshold. Sustained for 15 minutes, not instantaneous. A single failed run is not a page.
- Queue waiting count rising. Compare the current value to fifteen minutes ago rather than to a fixed number, so the threshold survives traffic growth.
- Webhook error rate. Per workflow, so a single noisy endpoint doesn’t mask the rest.
- Scrape target down. The
upmetric. Obvious, and routinely forgotten, and it invalidates every other rule on this list.
Troubleshooting: the endpoint returns nothing useful
- “Cannot GET /metrics”.
N8N_METRICSisn’t set on the process you’re hitting, or it’s set as a string that n8n doesn’t read as true. In Docker Compose, quote it as"true"and confirm withdocker compose exec n8n env | grep N8N_METRICS. - Endpoint responds but has no n8n_ counters. You have the default Node.js process metrics and nothing else. Set
N8N_METRICS_INCLUDE_MESSAGE_EVENT_BUS_METRICS=trueand restart. - Counters exist but no workflow_id label.
N8N_METRICS_INCLUDE_WORKFLOW_ID_LABELis off. Restart is required; it’s read at startup. - Queue metrics are zero or missing. They’re gathered from Bull and exposed on the main instance, not the workers. Querying the worker endpoint gives you nothing. Confirm you’re looking at the right target.
- Counters look wrong after a deploy. They reset to zero when the process restarts. Always wrap them in
rate()orincrease(), which handle counter resets. Raw counter values on a dashboard will lie to you every time you deploy. - Prometheus can’t reach the target. Usually a Docker network mismatch. Scrape by container name on the shared network rather than by published host port, and check the target page in Prometheus for the actual error rather than guessing.
Common mistakes
- Treating the success counter as proof the automation worked. It proves the run finished.
- Building only error-rate alerts, so the workflows that stop entirely go unmonitored.
- Enabling every
N8N_METRICS_INCLUDE_*variable on day one and discovering the cardinality bill a month later. - Scraping only the main instance in queue mode and losing all worker-side execution data.
- Copying label matchers out of documentation without running them and checking the returned series count.
- Exposing
/metricspublicly because it’s “just numbers”.
Best practices
- Decide which workflows are business-critical and write a silence alert for each one by name. Six good heartbeats beat two hundred generic panels.
- Run a second source of truth. Metrics tell you about volume, the executions API tells you about outcomes. You need both.
- Push the ID-to-name join into a recording rule so panels stay readable and cheap.
- Break a staging workflow on purpose and confirm the alert fires. An untested alert is a decoration.
- If you’d rather not run Prometheus and Grafana yourself, Grafana Cloud will scrape a remote endpoint and gives you alerting without a control plane to maintain. Weigh that against your metrics leaving your network.
FAQ
Does n8n expose a failed-executions counter?
Not a reliable per-workflow one. You get started and success counters from the event bus, and a failed-jobs counter for queue mode. Deriving failures by subtracting success from started works only if you’ve verified on your own instance that a failing run genuinely doesn’t increment success, which is exactly the assumption that breaks when nodes are set to continue on error.
Can I monitor n8n Cloud this way?
No. The /metrics endpoint isn’t available on n8n Cloud. On Cloud you’re limited to the public API and the built-in insights views, so the executions-API approach in this post is the only one that transfers.
Why does my workflow error rate look like zero when I know things are failing?
Almost always one of three things: the event bus metrics aren’t enabled so you’re only seeing Node.js process metrics, the failures are being absorbed by continue-on-error settings and recorded as successes, or you’re scraping the main instance while the work happens on workers.
How do I alert when a scheduled workflow stops running entirely?
Use absent_over_time against that workflow’s started counter with an exact workflow_id matcher, and set the window to about twice the expected interval. A threshold comparison won’t work, because a workflow that stops running stops producing the series you’d compare against.
Is enabling the workflow_id label safe on a large instance?
It multiplies your n8n series count by the number of workflows. On a few dozen it’s negligible. Past a few hundred, combined with node-type labels, watch your Prometheus memory and head series count before and after. Enable the workflow label, leave the node label off, and only turn the node one on when you have a specific question it answers.
Should I use OpenTelemetry instead of Prometheus for n8n?
They solve different problems. Metrics answer “how many, how often, how fast” cheaply and forever. Traces answer “where did this run spend its time and what did it call”, which is better for debugging a slow multi-service workflow. Tracing n8n usually means a custom image with the OpenTelemetry SDK loaded before startup, so it’s a project rather than an environment variable. Start with metrics; add tracing when you have a latency question metrics can’t answer.
Where do the n8n counters go when the container restarts?
They reset to zero. They’re in-process counters with no persistence. Prometheus handles this correctly as long as your queries use rate() or increase(). Any panel showing a raw counter value will appear to lose all its history on every deploy.
The one thing to take away
Monitoring n8n workflow failures in Grafana works, but only once you stop asking the metrics endpoint a question it can’t answer. It reports activity. Activity and correctness are different things, and the space between them is where the expensive outages live.
So build for absence first. A silence alert on the handful of workflows a human would miss will catch more real incidents than any error-rate panel, because errors are loud and stopped schedules are not. Then add attribution with the workflow label, then close the false-success gap with the executions API or an Error Trigger workflow. In that order, because each one is cheap and the value drops off fast after the third.
Need help wiring this up?
I build and maintain observability stacks for self-hosted automation platforms, and n8n is a common one. If any of the above sounds like a week you’d rather not spend, here’s what I can take off your plate:
- Enabling and securing the n8n metrics endpoint on a private network path, including queue-mode setups with multiple workers
- Building Prometheus scrape configs, recording rules and the ID-to-name join so your Grafana panels are readable rather than a wall of hashes
- Writing silence and error-rate alert rules that survive counter resets, Grafana No Data states and traffic growth
- Adding a second source of truth from the n8n executions API, either as a small exporter or an Error Trigger workflow feeding Loki or Pushgateway
- Auditing an existing setup for cardinality problems, stale Pushgateway series and alerts that quietly stopped being able to fire
- Running a failure drill against staging so you know which alerts actually work before you need them
Send me your Compose file, your prometheus.yml, or a screenshot of the panel that looks fine while things are on fire, and I’ll tell you what’s missing.