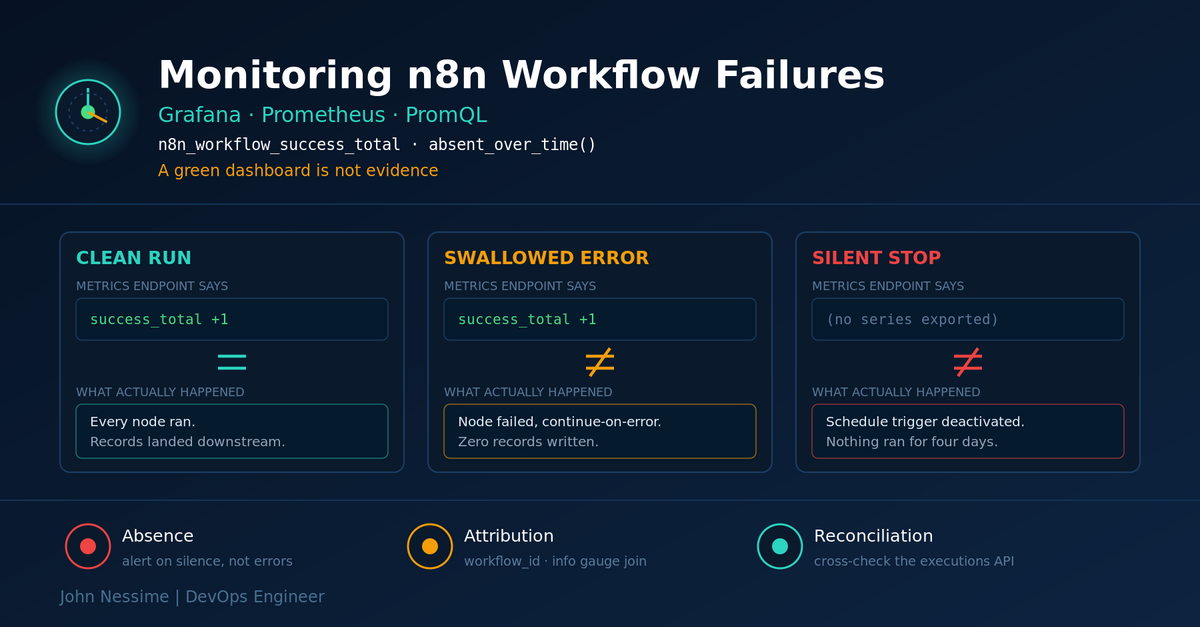
Monitoring n8n Workflow Failures in Grafana: Why Your Green Dashboard Is Lying
n8n's Prometheus endpoint tells you the process is alive and busy. It does not tell you a workflow stopped producing correct output. This post walks through the three failure families that slip past a default n8n dashboard, the PromQL that catches each one, and how to close the gap with a second source of truth from the executions API.