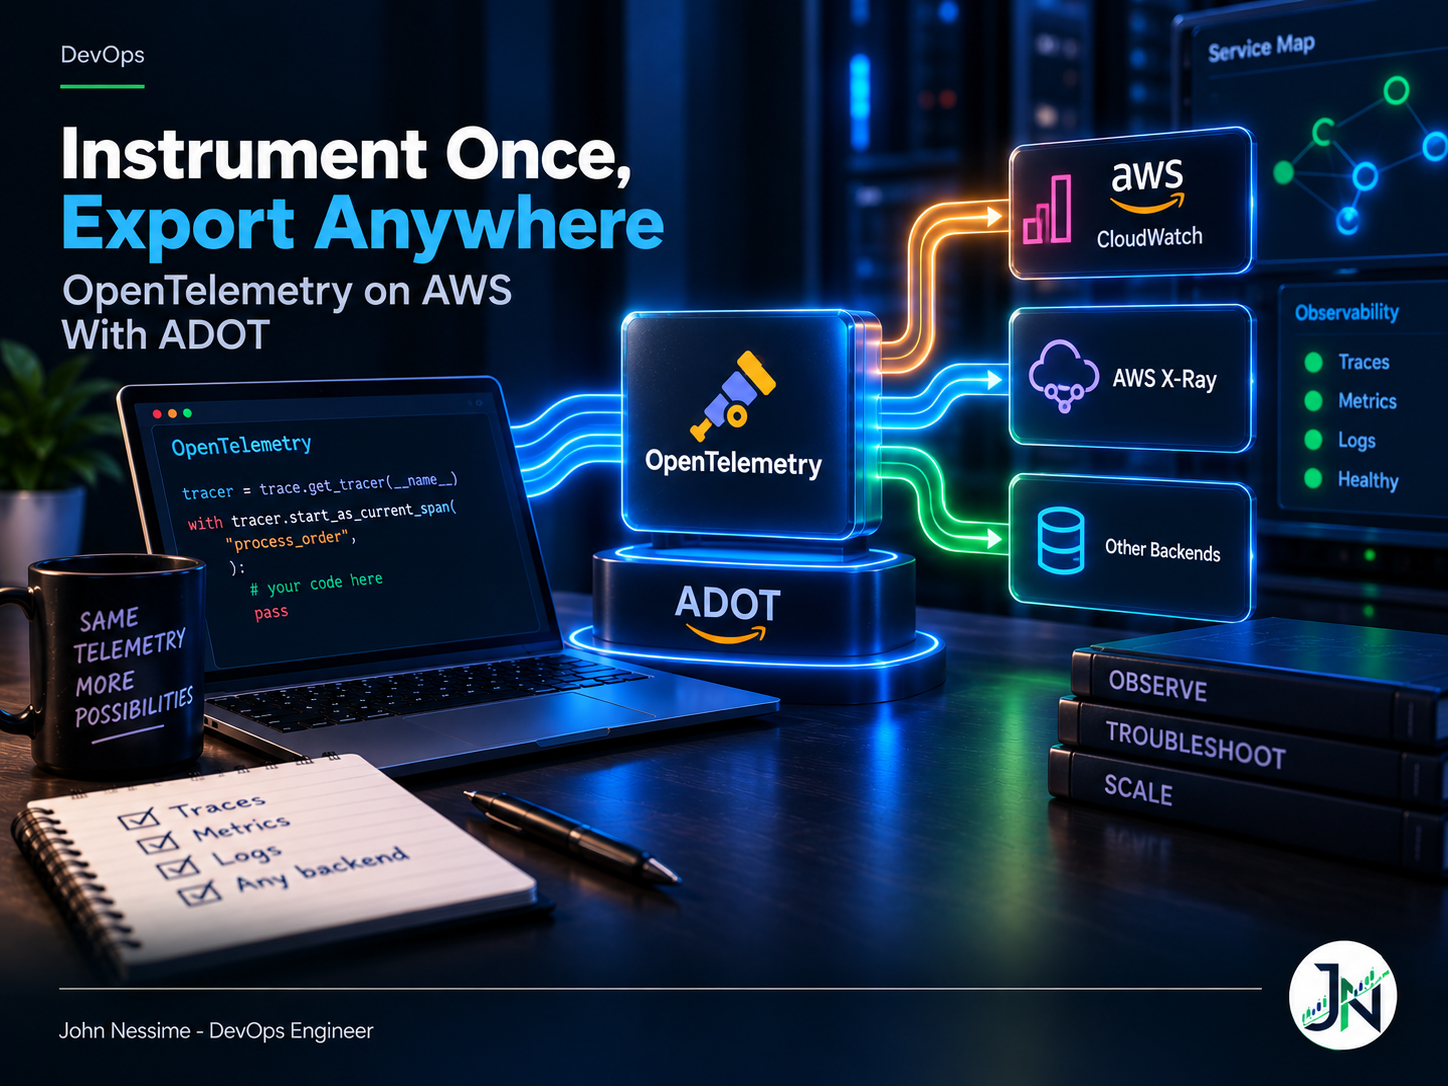
Instrument Once, Export Anywhere: OpenTelemetry on AWS With ADOT
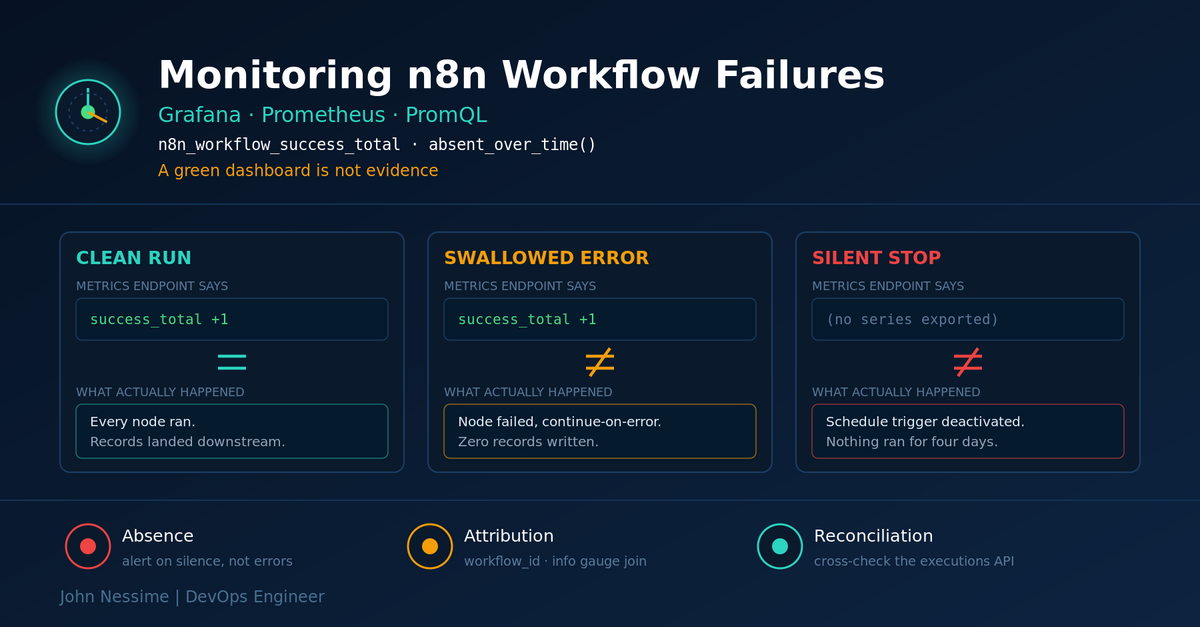
A pipeline that returns 200 is not a pipeline that works. The four decisions behind running OpenTelemetry on AWS with ADOT, the CloudWatch OTLP endpoint limits that drop data without erroring, and how to catch the failures before a colleague does.