Checkout is slow. Somebody says it in Slack, and within a minute three people are looking at three different screens. One is scrolling a dashboard where every panel looks normal. One is grepping logs for the word “error” and finding nothing. One is reading a trace for a request that completed in 40ms and wondering why they bothered.
Nobody is doing anything wrong. They are just using the wrong tool for the question at hand, and none of them has said out loud what question they are trying to answer.
Metrics, logs and traces get called the three pillars of observability, which makes them sound like three views of the same thing. They are not. They answer three different questions, and knowing which question you are asking is most of the skill.
The one-line version
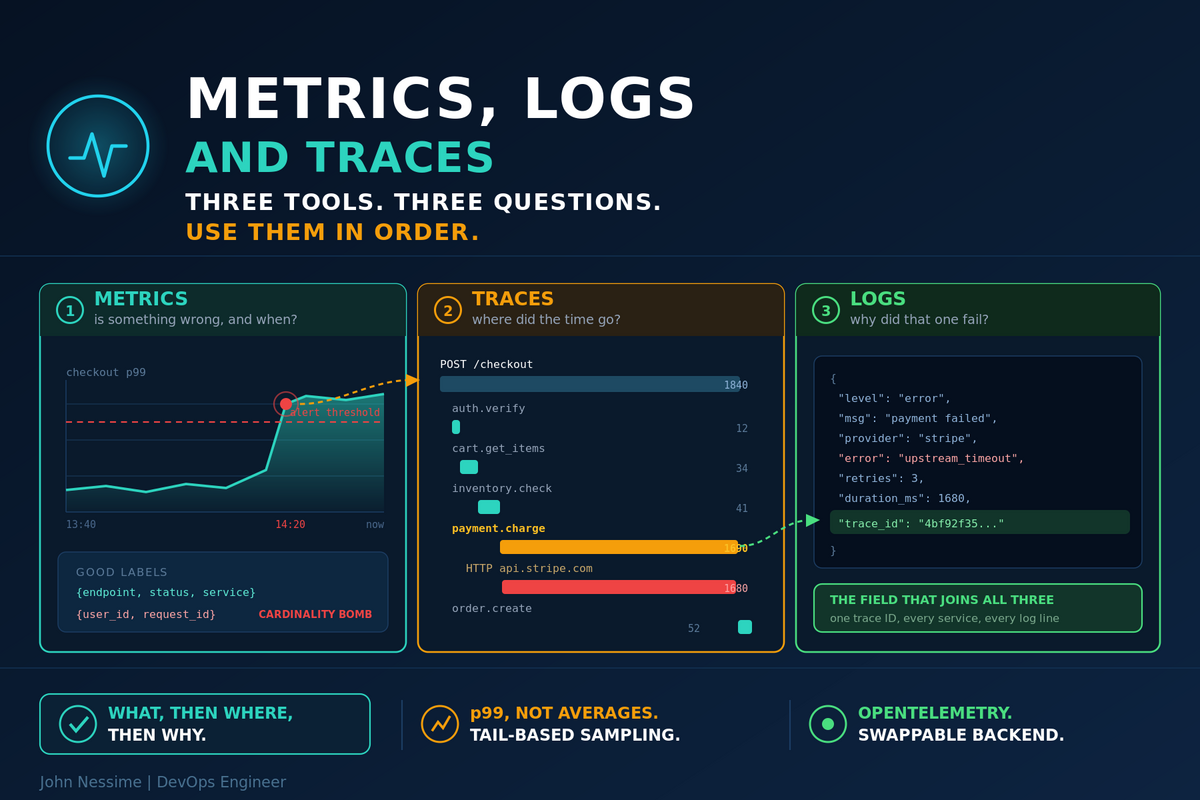
- Metrics tell you that something is wrong, and when it started.
- Traces tell you where in the system it is wrong.
- Logs tell you why that particular thing went wrong.
That ordering is also the order you should use them in during an incident. Starting with logs is the most common mistake, and it is why people end up grepping for twenty minutes before discovering the problem was a downstream service that never logged anything at all.
Metrics: numbers over time, and the cost of a label
A metric is a number sampled repeatedly. Requests per second, memory used, queue depth. They are cheap to store because each sample is a timestamp and a value, and they aggregate well — which is exactly what makes them right for dashboards and alerts, and wrong for investigating one specific user’s problem.
# Error rate as a proportion of all requests, per service
sum(rate(http_requests_total{status=~"5.."}[5m])) by (service)
  /
sum(rate(http_requests_total[5m])) by (service)
That query is answerable in milliseconds across months of history. No log search comes close.
Averages lie, and they lie in a specific direction
An average response time of 200ms is compatible with 95% of requests at 50ms and 5% at three seconds. The people having a terrible time are invisible in the mean, and they are the ones who complain.
# p99 latency by endpoint
histogram_quantile(0.99,
  sum(rate(http_request_duration_seconds_bucket[5m])) by (le, endpoint)
)
Alert on p95 or p99, look at p50 to understand the typical case, and be aware that averaging percentiles across instances is mathematically meaningless — you have to aggregate the histogram buckets first, which is what the query above does.
Cardinality is the thing that breaks Prometheus
Every unique combination of label values creates a separate time series. Add a label with unbounded values and you multiply your storage and memory by the number of distinct values.
# Fine. A handful of endpoints, a handful of statuses.
http_requests_total{endpoint="/checkout", status="200"}

# Catastrophic. One time series per user, forever.
http_requests_total{endpoint="/checkout", user_id="8a3f...", request_id="..."}
User IDs, request IDs, session tokens, full URLs with parameters, email addresses — none of these belong in a metric label. They belong in logs and traces, which are built for high-cardinality data.
To see whether you already have a problem:
# Which metric names have the most series?
topk(10, count by (__name__)({__name__=~".+"}))
Run that on any Prometheus that has been growing unexpectedly. The answer is usually one metric somebody added a request ID to.
Logs: the detail, once you know where to look
Logs are discrete events with arbitrary detail attached. Their strength is precision — the actual exception, the actual SQL statement, the actual value that was null. Their weakness is volume and cost, since you are storing every event rather than an aggregate.
Structured or it did not happen
Compare these two lines for the same event:
# Human readable, machine hostile
2026-01-15 14:32:11 ERROR Payment failed for user 8a3f after 3 retries

# Structured: queryable without regex archaeology
{"ts":"2026-01-15T14:32:11Z","level":"error","msg":"payment failed",
 "user_id":"8a3f","retries":3,"provider":"stripe","error_code":"card_declined",
 "trace_id":"4bf92f3577b34da6a3ce929d0e0e4736","duration_ms":1840}
With the second, “how many payments failed with card_declined on stripe in the last hour, grouped by retry count” is a query. With the first it is a regular expression that will break the next time someone rewords the message.
The field that ties everything together
Notice trace_id in that log line. That single field is what turns three separate tools into one workflow. Find a slow trace, take its ID, and pull every log line from every service involved in that exact request.
If you do one thing after reading this, make it that: get trace and span IDs into your structured logs. It is usually a few lines in a logging middleware and it changes how debugging feels.
Levels, used properly
- ERROR — something failed and a human may need to act. If nobody would act on it, it is not an error.
- WARN — recovered, but worth knowing. A retry succeeded, a fallback was used.
- INFO — meaningful state changes. Started, stopped, config loaded, job completed.
- DEBUG — off in production, on when you are actively investigating.
The failure mode is logging everything at INFO. You get volume, cost, and a signal that nobody reads because it is 99% noise. If your ERROR channel fires constantly and nobody looks, you have trained your team to ignore errors.
Sampling, when volume gets expensive
Keep all errors and warnings. Sample the successful path — one in a hundred INFO lines from a healthy endpoint tells you the same thing as all hundred, at a fraction of the cost. Never sample errors. The one you drop is the one you needed.
Traces: where the time actually went
A trace follows one request across every service it touches. Each unit of work is a span, with a start time, duration, and a parent — so the trace becomes a tree showing exactly where the milliseconds went.
POST /checkout                                    1840ms
├─ auth.verify_token                                12ms
├─ cart.get_items                                   34ms
│  └─ SELECT * FROM cart_items WHERE ...            28ms
├─ inventory.check_stock                            41ms
├─ payment.charge                                 1690ms   ← here
│  ├─ HTTP POST api.stripe.com/v1/charges         1680ms
│  └─ db.insert payment_record                       8ms
└─ order.create                                     52ms
No amount of dashboard-staring gets you there that fast. The metric told you p99 checkout latency doubled; the trace tells you it is one outbound HTTP call, and now you know whether to look at your code or send an email to a vendor.
Traces are also how you find work you did not know about
The classic find is the N+1 query — a trace showing four hundred nearly identical database spans where you expected one. That is invisible in metrics, because four hundred fast queries look healthy in aggregate, and invisible in logs unless you happen to log every query.
Context propagation is the part that breaks
Tracing works because each service passes the trace context to the next one, usually in the W3C traceparent header:
traceparent: 00-4bf92f3577b34da6a3ce929d0e0e4736-00f067aa0ba902b7-01
             │  │                                │                │
             │  └─ trace ID                      └─ parent span   └─ flags
             └─ version
Break that chain anywhere and your trace splits in two, with the second half orphaned and useless. The usual culprits: a service that does not forward the header, a message queue where nobody propagated context into the consumer, or a thread pool that lost the context on handoff. Async boundaries are where this fails most often.
Sampling, and why tail-based is worth the trouble
Tracing everything at scale is expensive, so you sample. The distinction matters:
- Head-based — decide at the start of the request. Simple, cheap, and it throws away most of your errors, because errors are rare and the dice were rolled before anything went wrong.
- Tail-based — decide after the request finishes, when you know it was slow or failed. Keep every error, keep the slow tail, sample the boring successes at 1%.
Tail-based needs a collector that buffers spans until the trace completes, which costs memory and adds a component. It is almost always worth it, because a trace store full of successful requests is a trace store you never open.
Using all three: an incident, in order
- An alert fires on a metric. Checkout p99 latency crossed its threshold at 14:20. You know what and when.
- Check the metric’s shape. Step change or gradual climb? Correlated with a deploy, traffic spike, or nothing? Which service, which endpoint?
- Open a slow trace from that window. Not an average one — filter for the slow tail. Find the span holding the time.
- Take the trace ID into your logs. Now you are reading a handful of lines from the exact request, not grepping a firehose.
- Confirm the fix with the metric you started from. The graph coming back down is what closes the incident.
Every step narrows the search. Metrics cover everything at low detail, traces cover one request at high detail, logs cover one moment at full detail. Going straight to logs means searching everything at full detail, which is why it feels like archaeology.
What to instrument if you are starting from nothing
Do not try to do all three at once. In order of value per hour spent:
- Request rate, error rate and duration per endpoint. These three metrics answer most operational questions and take an afternoon with a middleware.
- Structured logs with a request ID. Even without tracing, a request ID threaded through your logs is transformative.
- Host metrics. CPU, memory, disk, network. Answers “is the machine underneath healthy” before you debug the application.
- Tracing on your slowest or most critical path. Not everything. Checkout, or whatever your equivalent is.
- Trace IDs in log lines, once tracing exists. This is the step that connects the tools.
Instrument with OpenTelemetry rather than a vendor SDK. The API is vendor-neutral, so switching backends later is a collector config change instead of touching every service. That is the single decision most likely to save you a painful migration.
Common mistakes
- Starting an investigation in logs rather than metrics.
- Putting user IDs, request IDs or full URLs into metric labels.
- Alerting on averages instead of percentiles.
- Averaging percentiles across instances, which is not a meaningful operation.
- Unstructured log messages that require regular expressions to query.
- Head-based trace sampling, which discards most of your errors by construction.
- Sampling error logs to save money.
- No trace or request ID in logs, leaving the three tools unconnected.
- Instrumenting with a vendor SDK and discovering the cost of that choice at renewal time.
Best practices
- Keep metric cardinality bounded and check your top series periodically.
- Log structured JSON with consistent field names across services.
- Propagate trace context everywhere, especially across queues and async boundaries.
- Use tail-based sampling so errors and slow requests are always kept.
- Set retention by usefulness: metrics for months, traces for days, logs somewhere between.
- Alert on symptoms users feel — latency, errors, saturation — not on internal counters nobody can act on.
- Standardise on OpenTelemetry so the backend stays replaceable.
Frequently asked questions
Do I need all three?
Not immediately. A single service with good metrics and structured logs is well covered. Tracing earns its cost when a request crosses several services and “which one is slow” stops being obvious.
What is the difference between monitoring and observability?
Monitoring watches for failure modes you predicted. Observability is being able to answer questions you did not think of in advance. Metrics and alerts are mostly monitoring; high-cardinality traces and structured logs are what make a system observable.
Why is my Prometheus using so much memory?
Almost always cardinality. Memory tracks the number of active time series, not the number of hosts. Find the offending metric with a top-series query — it will usually be one where somebody added an unbounded label.
Can I put logs into metrics or the reverse?
You can derive metrics from logs, and it is a reasonable stopgap when you cannot change the application. It is more expensive than emitting metrics directly and the resolution is worse. Going the other way — reconstructing event detail from metrics — is not possible, since aggregation discards it.
How long should I keep each?
Metrics are cheap and useful for capacity planning, so months. Traces are large and mostly interesting while an incident is fresh, so days. Logs sit in between and are usually driven by compliance rather than debugging value.
Is tracing worth it for a monolith?
Often yes, because spans still reveal internal structure — which query, which external call, how many times. The N+1 problem shows up just as clearly in a monolith as in a distributed system.
Wrapping up
Metrics, logs and traces are not three ways of looking at the same data. Metrics are aggregates over time and answer whether something is wrong. Traces follow one request and answer where. Logs are individual events and answer why. Reach for them in that order and each step makes the next one smaller.
If your setup is incomplete, the highest-value gap is usually the connective tissue rather than another data source. Trace IDs in structured logs, consistent field names, bounded metric labels. Those three make the tools you already have work together, which is worth more than adding a fourth.
Want your observability stack to actually answer questions?
I work with teams on observability that earns its cost — metrics with sane cardinality, structured logging that is queryable, OpenTelemetry instrumentation that survives a backend change, and alerts that fire on things people can act on.
If your dashboards look healthy while users complain, you can hire me on Upwork.