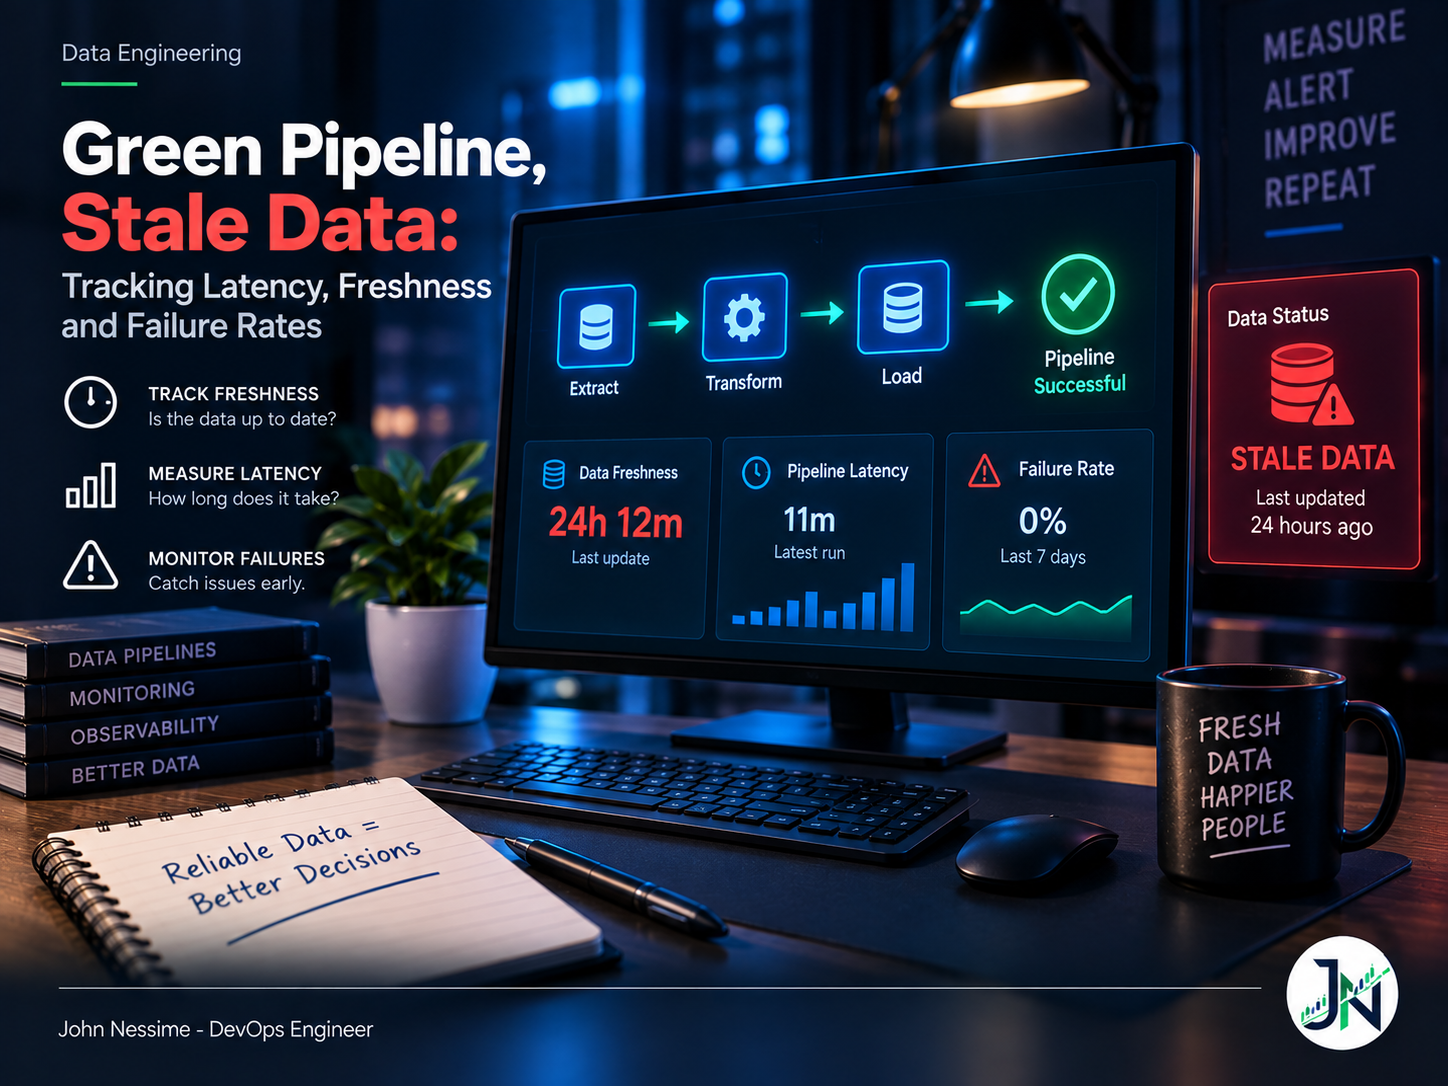
Grafana Monitoring for AWS Data Pipelines: The Green Dashboard Problem

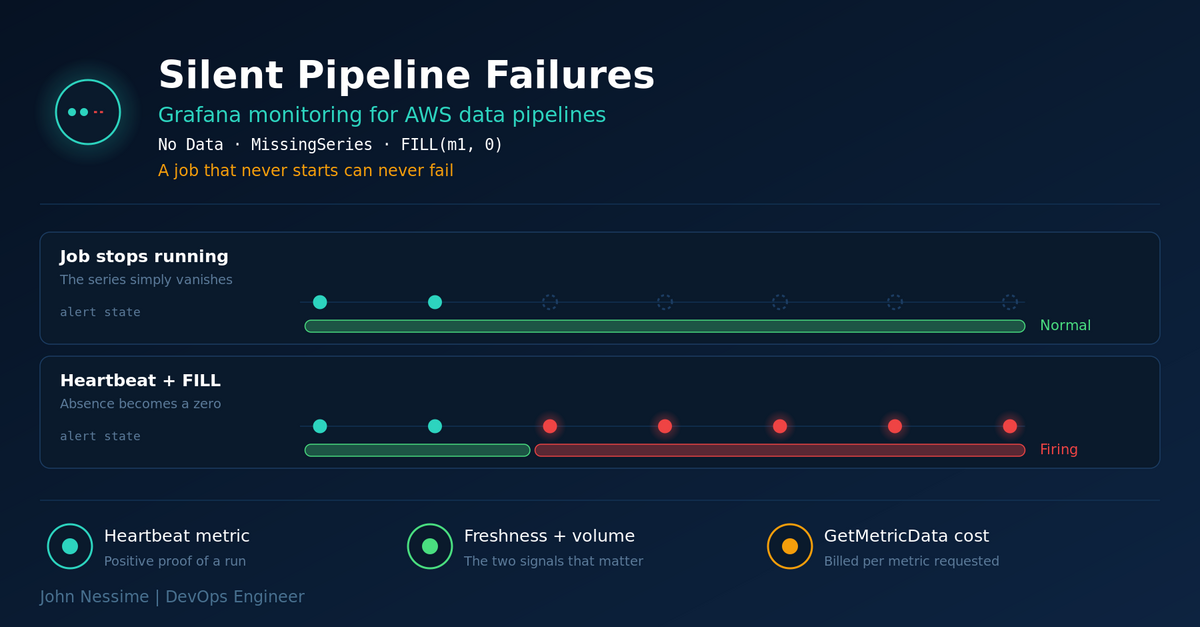
A Glue job that stops running emits no metrics, so the dashboard stays green and the alert quietly resolves itself. Here is why Grafana monitoring for AWS data pipelines misses that failure, and the heartbeat, metric math and no-data configuration that closes the gap, along with the CloudWatch query costs and IAM boundaries nobody warns you about.

Continue ReadingGrafana Monitoring for AWS Data Pipelines: The Green Dashboard Problem

CloudWatch Data Pipeline Monitoring: Catching the Runs That Succeed and Deliver Nothing

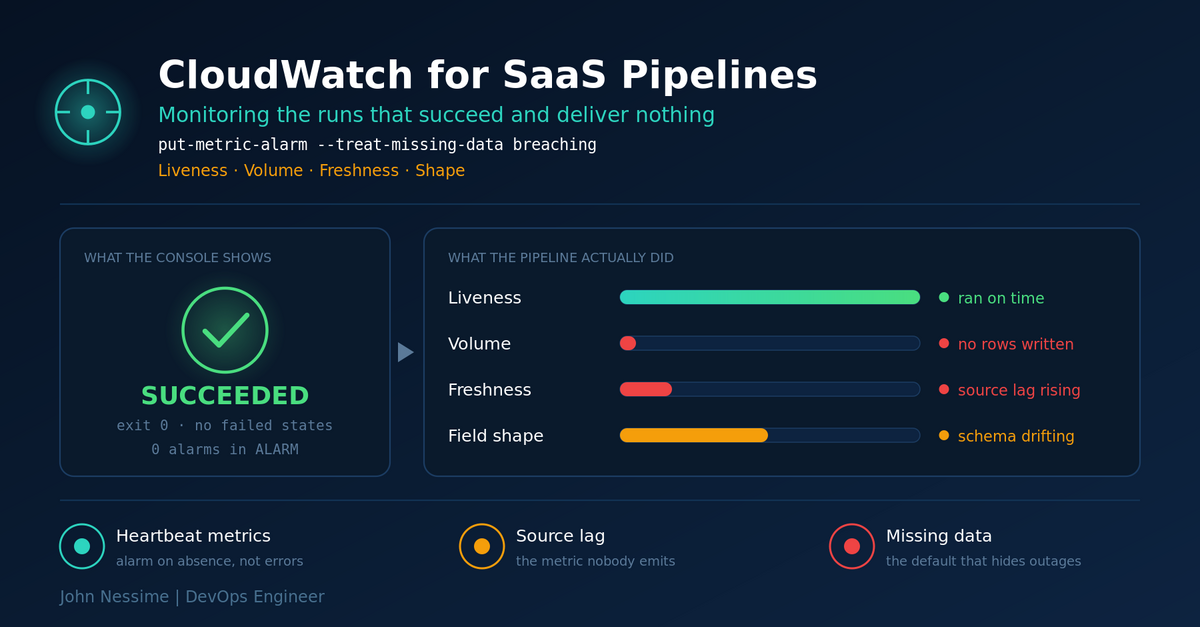
Your SaaS pipeline will fail far more often by succeeding at nothing than by throwing an exception, and every CloudWatch default treats an absent metric as a non-event. Here are the four signals worth alarming on: liveness, volume, freshness and shape, plus the missing-data traps that leave alarms permanently green.

Continue ReadingCloudWatch Data Pipeline Monitoring: Catching the Runs That Succeed and Deliver Nothing