Grafana Monitoring for AWS Data Pipelines: The Green Dashboard Problem
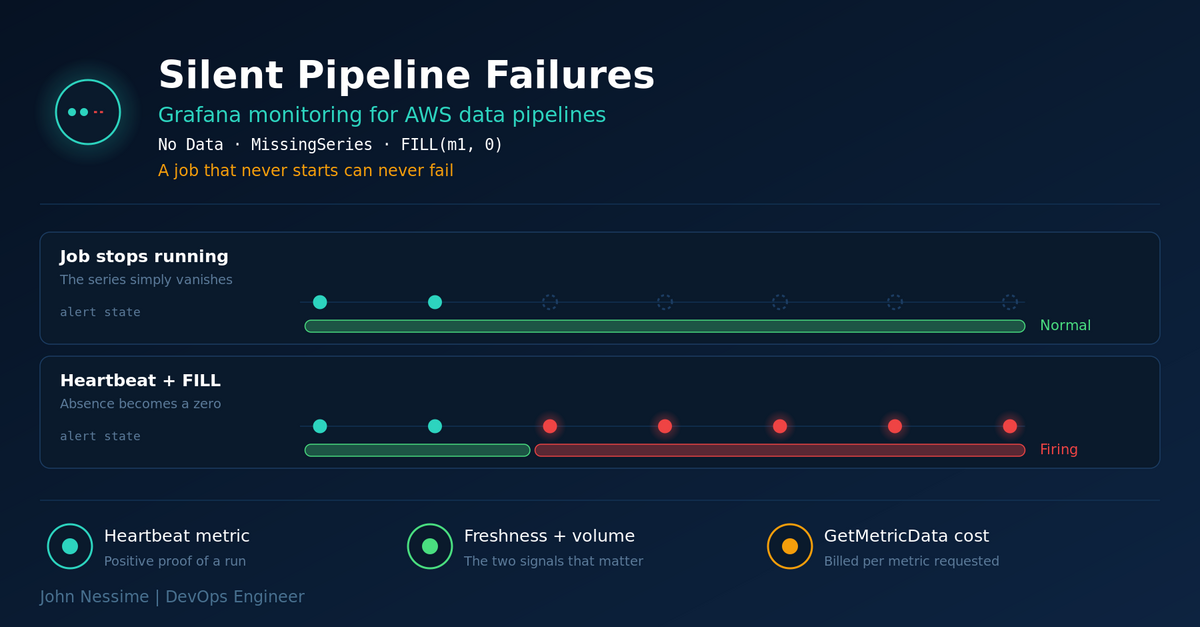
A Glue job that stops running emits no metrics, so the dashboard stays green and the alert quietly resolves itself. Here is why Grafana monitoring for AWS data pipelines misses that failure, and the heartbeat, metric math and no-data configuration that closes the gap, along with the CloudWatch query costs and IAM boundaries nobody warns you about.