You want to know when the disk fills up before a customer tells you. Search for how to do that and you get pointed at a hosted platform with per-host pricing, or a twelve-service Docker Compose file that somebody copy-pasted from a blog and does not fully understand either.
For a single server, neither is the right answer. Prometheus and Grafana are two static Go binaries and a package. They run happily under systemd, use very little memory at this scale, and when something breaks you can read the logs and actually fix it. No container networking to debug, no orchestration layer between you and the problem.
This walks through the whole thing: install Prometheus and Grafana from scratch, wire in node_exporter, put the lot behind nginx with TLS, and lock down the ports that should never have been public in the first place. Commands work on both Debian-family and RHEL-family systems, with the differences called out.
What you are building
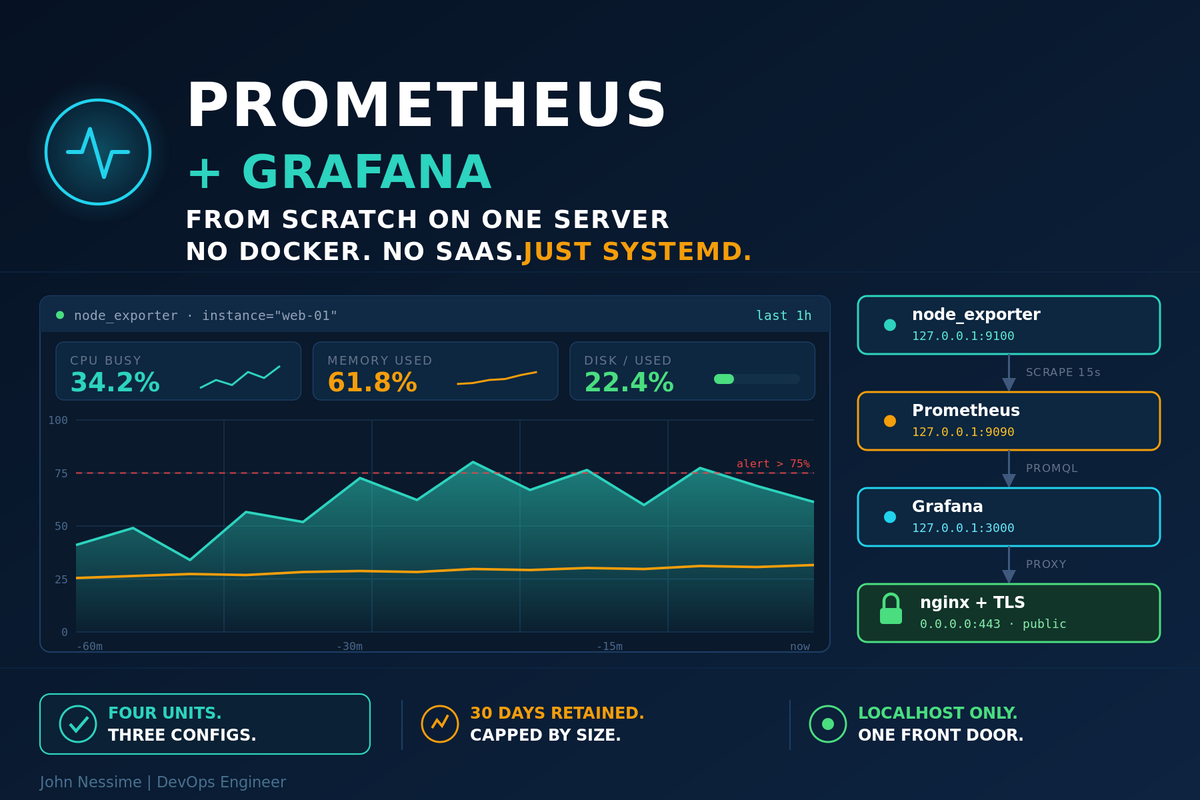
Four moving parts, all on one box:
- node_exporter exposes machine metrics — CPU, memory, disk, network — on port 9100.
- Prometheus scrapes that endpoint on a schedule and stores the samples in its own time series database on port 9090.
- Grafana queries Prometheus and draws the dashboards on port 3000.
- nginx terminates TLS and is the only thing listening on a public interface.
The critical design decision is in that last line. Prometheus and node_exporter ship with no authentication at all. Bound to a public interface, they hand your entire infrastructure inventory to anyone who runs a port scan. Everything binds to 127.0.0.1 and nginx is the single front door.
Resource-wise, a 2 GB VPS handles this comfortably for one server’s worth of metrics. Prometheus is the memory-hungry one, and its appetite scales with the number of active time series rather than the number of hosts.
Step 1: Users and directories
Neither service should run as root, and neither needs a login shell.
sudo useradd --system --no-create-home --shell /sbin/nologin prometheus
sudo useradd --system --no-create-home --shell /sbin/nologin node_exporter

sudo mkdir -p /etc/prometheus /var/lib/prometheus
sudo chown prometheus:prometheus /etc/prometheus /var/lib/prometheus
On Debian and Ubuntu the nologin shell lives at /usr/sbin/nologin rather than /sbin/nologin. Check with which nologin if useradd complains.
Step 2: Install Prometheus
Prometheus ships as a single static binary. Rather than hardcoding a version that will be stale next month, pull the current release tag from the API:
PROM_VERSION=$(curl -s https://api.github.com/repos/prometheus/prometheus/releases/latest
  | grep -Po '"tag_name": "vK[^"]*')
echo "Installing Prometheus ${PROM_VERSION}"

cd /tmp
curl -LO "https://github.com/prometheus/prometheus/releases/download/v${PROM_VERSION}/prometheus-${PROM_VERSION}.linux-amd64.tar.gz"
tar xzf "prometheus-${PROM_VERSION}.linux-amd64.tar.gz"
cd "prometheus-${PROM_VERSION}.linux-amd64"

sudo cp prometheus promtool /usr/local/bin/
sudo chown prometheus:prometheus /usr/local/bin/prometheus /usr/local/bin/promtool
If you are on ARM, swap linux-amd64 for linux-arm64.
The configuration file
Write /etc/prometheus/prometheus.yml:
global:
  scrape_interval: 15s
  evaluation_interval: 15s

scrape_configs:
  - job_name: prometheus
    static_configs:
      - targets: ["127.0.0.1:9090"]

  - job_name: node
    static_configs:
      - targets: ["127.0.0.1:9100"]
        labels:
          instance: "web-01"
Set that instance label deliberately. It follows every metric into every dashboard and alert, and renaming it later means your historical graphs split in two.
Validate before you start anything:
promtool check config /etc/prometheus/prometheus.ymlThe systemd unit
Write /etc/systemd/system/prometheus.service:
[Unit]
Description=Prometheus
Wants=network-online.target
After=network-online.target

[Service]
User=prometheus
Group=prometheus
Type=simple
Restart=on-failure
RestartSec=5
ExecStart=/usr/local/bin/prometheus
  --config.file=/etc/prometheus/prometheus.yml
  --storage.tsdb.path=/var/lib/prometheus
  --storage.tsdb.retention.time=30d
  --storage.tsdb.retention.size=8GB
  --web.listen-address=127.0.0.1:9090
ExecReload=/bin/kill -HUP $MAINPID

NoNewPrivileges=true
ProtectSystem=strict
ProtectHome=true
ReadWritePaths=/var/lib/prometheus
PrivateTmp=true

[Install]
WantedBy=multi-user.target
Two things worth noticing. --web.listen-address=127.0.0.1:9090 is what keeps Prometheus off the public internet. And setting both retention flags matters — time-based retention alone will not save you if metric volume spikes, because Prometheus honours whichever limit it hits first.
sudo systemctl daemon-reload
sudo systemctl enable --now prometheus
sudo systemctl status prometheus
Step 3: node_exporter
Same pattern — a static binary and a unit file.
NE_VERSION=$(curl -s https://api.github.com/repos/prometheus/node_exporter/releases/latest
  | grep -Po '"tag_name": "vK[^"]*')

cd /tmp
curl -LO "https://github.com/prometheus/node_exporter/releases/download/v${NE_VERSION}/node_exporter-${NE_VERSION}.linux-amd64.tar.gz"
tar xzf "node_exporter-${NE_VERSION}.linux-amd64.tar.gz"
sudo cp "node_exporter-${NE_VERSION}.linux-amd64/node_exporter" /usr/local/bin/
sudo chown node_exporter:node_exporter /usr/local/bin/node_exporter
Then /etc/systemd/system/node_exporter.service:
[Unit]
Description=Prometheus Node Exporter
Wants=network-online.target
After=network-online.target

[Service]
User=node_exporter
Group=node_exporter
Type=simple
Restart=on-failure
ExecStart=/usr/local/bin/node_exporter
  --web.listen-address=127.0.0.1:9100

NoNewPrivileges=true
ProtectHome=true
PrivateTmp=true

[Install]
WantedBy=multi-user.target
sudo systemctl daemon-reload
sudo systemctl enable --now node_exporter
# Confirm it is actually producing metrics
curl -s http://127.0.0.1:9100/metrics | head -20Now open http://127.0.0.1:9090/targets — via an SSH tunnel, since it is not public — and both jobs should read UP.
# From your laptop
ssh -L 9090:127.0.0.1:9090 you@your-server
Step 4: Install Grafana
Grafana is packaged properly, so use the official repository rather than a tarball. It gets you signed updates through your normal patching process.
Debian and Ubuntu:
sudo apt-get install -y apt-transport-https software-properties-common wget
sudo mkdir -p /etc/apt/keyrings/
wget -q -O - https://apt.grafana.com/gpg.key
  | gpg --dearmor | sudo tee /etc/apt/keyrings/grafana.gpg > /dev/null

echo "deb [signed-by=/etc/apt/keyrings/grafana.gpg] https://apt.grafana.com stable main"
  | sudo tee /etc/apt/sources.list.d/grafana.list

sudo apt-get update
sudo apt-get install -y grafana
RHEL, AlmaLinux, Rocky:
sudo tee /etc/yum.repos.d/grafana.repo > /dev/null <<'EOF'
[grafana]
name=grafana
baseurl=https://rpm.grafana.com
repo_gpgcheck=1
enabled=1
gpgcheck=1
gpgkey=https://rpm.grafana.com/gpg.key
sslverify=1
sslcacert=/etc/pki/tls/certs/ca-bundle.crt
EOF

sudo dnf install -y grafana
Bind it to localhost too
Edit /etc/grafana/grafana.ini:
[server]
http_addr = 127.0.0.1
http_port = 3000
domain = metrics.example.com
root_url = https://metrics.example.com/

[security]
admin_user = admin
admin_password = put-something-real-here
cookie_secure = true

[users]
allow_sign_up = false
Getting root_url right matters more than it looks. Set it wrong and Grafana generates broken links and redirects behind the proxy, which produces a confusing half-working UI rather than a clean error.
sudo systemctl enable --now grafana-serverStep 5: Put nginx and TLS in front
This is the only piece that faces the internet.
server {
    listen 443 ssl;
    server_name metrics.example.com;

    ssl_certificate     /etc/letsencrypt/live/metrics.example.com/fullchain.pem;
    ssl_certificate_key /etc/letsencrypt/live/metrics.example.com/privkey.pem;

    location / {
        proxy_pass http://127.0.0.1:3000;
        proxy_set_header Host              $host;
        proxy_set_header X-Real-IP         $remote_addr;
        proxy_set_header X-Forwarded-For   $proxy_add_x_forwarded_for;
        proxy_set_header X-Forwarded-Proto $scheme;
    }

    # Grafana Live needs websockets, and breaks silently without this
    location /api/live/ {
        proxy_http_version 1.1;
        proxy_set_header Upgrade    $http_upgrade;
        proxy_set_header Connection "Upgrade";
        proxy_set_header Host       $host;
        proxy_pass http://127.0.0.1:3000;
    }
}
Note fullchain.pem rather than cert.pem. Getting that wrong produces a site that works in your browser and fails for anything else.
Then close the metrics ports at the firewall, belt and braces:
# firewalld
sudo firewall-cmd --permanent --add-service=https
sudo firewall-cmd --reload

# ufw
sudo ufw allow 443/tcp

# Verify nothing unexpected is listening publicly
sudo ss -tlnp | grep -E '9090|9100|3000'
Every line of that last command should show 127.0.0.1. If you see 0.0.0.0 or *, something is exposed and you should fix it before going any further.
Step 6: Connect Grafana to Prometheus
You can click through the UI, but provisioning it as a file means a rebuilt server comes back identical. Create /etc/grafana/provisioning/datasources/prometheus.yml:
apiVersion: 1

datasources:
  - name: Prometheus
    type: prometheus
    access: proxy
    url: http://127.0.0.1:9090
    isDefault: true
Restart Grafana, log in, and import dashboard ID 1860 from the Grafana dashboard library — Node Exporter Full. It is comprehensive, well maintained, and will show you more about your server than you knew was measurable.
Sizing the disk before it bites
Prometheus storage is predictable. Roughly:
disk = retention_seconds × samples_per_second × bytes_per_sampleCompressed samples land in the region of one to two bytes each. Measure your actual rate rather than guessing — run this in the Prometheus query box:
rate(prometheus_tsdb_head_samples_appended_total[5m])One server with node_exporter at a 15 second interval is a small number, and 30 days fits in a few gigabytes. The number climbs fast once you add exporters, so keep --storage.tsdb.retention.size set as a hard ceiling. Prometheus filling the root partition takes the rest of the box down with it, which is a memorable way to discover your monitoring has no monitoring.
Troubleshooting
A target shows DOWN
Work outward from the exporter:
curl -s http://127.0.0.1:9100/metrics | head
sudo systemctl status node_exporter
sudo journalctl -u prometheus -n 50 --no-pager
On RHEL-family systems with SELinux enforcing, this is frequently SELinux rather than your config. Check before you start changing things:
sudo ausearch -m avc -ts recentIf that shows denials, write a policy for them. Do not reach for setenforce 0 — it fixes today’s symptom and quietly removes a layer of protection from the whole machine.
Grafana loads but every panel says “No data”
Almost always the datasource URL. It must be http://127.0.0.1:9090 from Grafana’s point of view, not your public hostname. Test the datasource from its settings page — Grafana reports the actual connection error, which is more useful than the empty panel.
Prometheus will not start
sudo journalctl -u prometheus -n 50 --no-pager
promtool check config /etc/prometheus/prometheus.yml
ls -la /var/lib/prometheus
The usual culprits are a YAML indentation error, or /var/lib/prometheus not being owned by the prometheus user after a manual file copy.
Broken styling or redirect loops behind the proxy
root_url in grafana.ini does not match how you are actually reaching the site. If you are serving from a subpath, you also need serve_from_sub_path = true.
Common mistakes
- Leaving 9090, 9100 or 3000 on a public interface. Prometheus has no authentication whatsoever.
- Keeping the default Grafana admin password because it prompts you to change it and you clicked past.
- Setting no retention limits and discovering the problem when the root partition fills.
- Dropping
scrape_intervalto 1s because more data seems better. It multiplies storage and buys you nothing at this scale. - Never backing up
/var/lib/grafana/grafana.db, which holds every dashboard you have built. - Running everything as root because the tutorial you followed did.
- Building dashboards but configuring no alerts, so you still find out from a user.
Best practices
- Bind every component to localhost and expose exactly one TLS endpoint.
- Set both time and size retention. Whichever triggers first is the one you want.
- Provision datasources and dashboards as files, so the config lives in version control.
- Back up the Grafana SQLite database on the same schedule as everything else that matters.
- Add an external uptime check. Self-hosted monitoring cannot tell you that the server it lives on has gone.
- Write a handful of alerts you will genuinely act on. Alerts nobody responds to train people to ignore alerts.
- Use systemd’s sandboxing directives. They cost nothing and limit what a compromised exporter can reach.
Frequently asked questions
Should I use Docker instead?
For a single server, systemd is simpler. Two static binaries and a package, with no container networking layer between you and the logs. Containers earn their keep once you are managing several hosts or already run everything else that way.
How much RAM does this need?
A 2 GB VPS is comfortable for one server. Prometheus memory tracks active time series rather than host count, so it grows when you add exporters, not when you add machines with the same exporters.
Can I monitor more servers later?
Yes. Install node_exporter on each and add them as targets. The moment metrics cross a network, though, that traffic needs protecting — a VPN, an SSH tunnel, or TLS with client certificates. Do not simply open 9100 to the world.
Where do alerts come from?
Two options. Grafana’s built-in alerting works from dashboard queries and is the quicker path. Alertmanager, run alongside Prometheus, is more powerful for routing, grouping and silencing. Start with Grafana’s and move if you outgrow it.
How long should I keep metrics?
Thirty days covers most troubleshooting and capacity questions. Longer retention on a single box is usually a sign you want a remote-write backend rather than a bigger disk.
Do I need node_exporter if I only care about my application?
Install it anyway. When the application misbehaves, the first question is whether the machine underneath it is healthy, and node_exporter is what answers that.
Wrapping up
Once you install Prometheus and Grafana this way, the whole stack is four systemd units and three config files. Everything binds to localhost, nginx handles TLS, and there is no layer of abstraction between you and a problem when something breaks at an inconvenient hour.
Get the dashboard working first, then spend an evening writing three or four alerts you will actually respond to. A dashboard tells you what happened when you go looking. An alert is what stops you needing to look.
Want this set up properly?
I build monitoring stacks for teams who would rather not spend a weekend on it — Prometheus and Grafana on bare servers or in Kubernetes, exporters for the things you actually run, alert rules tuned so they mean something, and dashboards that answer real questions rather than filling a screen.
If that sounds useful, you can hire me on Upwork.