The CPU alarm has been green for six weeks. That is not because the instance is healthy. It is because the agent stopped publishing the metric, the alarm quietly slid into INSUFFICIENT_DATA, and nobody ever wired that state to anything. Green on the dashboard, deaf in production.
That is the failure mode nobody catches during a review, and it is why most AWS accounts have dozens of alarms and about three anyone trusts. The rest either fire constantly and get muted, or never fire at all and get mistaken for coverage.
This post is about building useful CloudWatch alarms: which signals deserve a page, which settings decide whether an alarm fires correctly, how to collapse alarm storms without going blind, and how to prove the notification path works before you need it.
The test an alarm has to pass before it exists
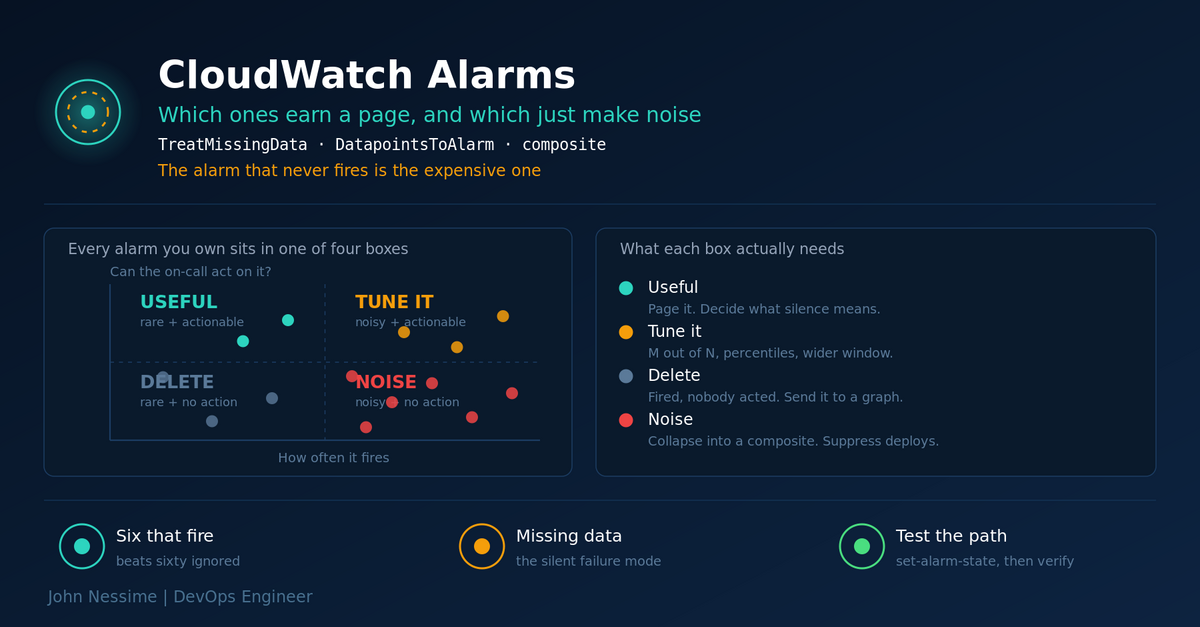
Before the threshold, before the metric, one question: if this fires at 3am, what does the person on call do?
If the honest answer is “look at it and go back to bed”, it is not an alarm. It is a dashboard panel. That single filter removes most of the CPU, memory and disk alarms people inherit. High CPU is not an incident. High CPU while latency climbs and the queue backs up is an incident. Every alarm that fires without requiring action trains the on-call to ignore the channel, and that training is permanent.
- Page on symptoms a customer can feel: error rate, latency at a high percentile, queue age, failed jobs, expiring credentials.
- Ticket on causes that bite next week: disk trending toward full, approaching a service quota, a renewal that is not happening.
- Graph only on everything else. Resource utilisation is context during an incident, not the incident.
Encode that split in the alarm’s action, not in your head. A page goes to an SNS topic wired to PagerDuty or Opsgenie. A ticket goes to a different topic that opens a Jira issue or a Systems Manager OpsItem. Same engine, different consequences.
The alarm that goes quiet: missing data is the invisible failure
Every metric alarm has a TreatMissingData setting, and if you never touched it, it is missing. That default means the alarm ignores gaps entirely when deciding state. It keeps whatever state it had, or sits in INSUFFICIENT_DATA if there is nothing at all. For a metric that always reports, that is a silent hole: the instance dies, the metric stops, and the alarm does not go red. It just stops having an opinion.
breachingfor metrics that report continuously. If the data stops, something is wrong. Heartbeats, health checks, CPU on a box that should always be up.notBreachingfor metrics that only exist when something bad happens. Error counts, throttled requests, dead letter queue depth. No data means no errors.ignorekeeps the current state through gaps, so an alarm stays red until genuinely resolved rather than flapping to OK on a hole in the data.missingis the default, and defensible only when you decided it was right.
There is a second-order effect that surprises people. When an alarm evaluates, CloudWatch pulls a wider range of data points than the evaluation periods you configured. AWS calls that the evaluation range. If some points in that range are missing but enough real ones exist, CloudWatch evaluates against the real points and your missing-data setting never applies to the gaps.
The consequence: an alarm set to eight breaching points out of ten can fire on one breaching point followed by nine gaps, because the older breach is still inside the evaluation range and everything newer is absent. Teams hit this with load balancer 5XX alarms constantly, and it looks exactly like an unexplained false positive.
Setting notBreaching on sparse error metrics is usually the fix. Filling gaps with metric math is the other, and it is more explicit:
# Treat absent error data points as zero rather than as gaps.
# m1 is the raw error metric; e1 is what the alarm evaluates.
e1 = FILL(m1, 0)
One exception: alarms on metrics in the AWS/DynamoDB namespace always ignore missing data regardless of what you set. If you need a DynamoDB alarm that reacts to silence, build the fill into metric math.
Then find the ones already stuck. This is the fastest audit you can run on an inherited account:
aws cloudwatch describe-alarms
  --state-value INSUFFICIENT_DATA
  --query 'MetricAlarms[].[AlarmName,MetricName,StateReason]'
  --output table
Anything on that list older than a deploy cycle is either watching something that no longer exists, or watching something that stopped reporting. Both deserve thirty seconds.
The alarm that cries wolf: periods, data points and windows
Three settings decide whether an alarm is jumpy: Period (how long each data point covers), EvaluationPeriods (how many recent points to look at), and DatapointsToAlarm (how many of those must breach).
M out of N beats consecutive breaches
Most people set evaluation periods to 3 and leave data points to alarm unset, which makes it 3 as well. That demands three consecutive breaching points. Real degradation is rarely that tidy; it flickers, one clean point resets your patience, and the alarm never fires.
Set them separately. Three out of five catches intermittent problems while still filtering single-point spikes. The breaching points do not need to be consecutive, only inside the last N.
aws cloudwatch put-metric-alarm
  --alarm-name "api-5xx-elevated"
  --namespace "AWS/ApplicationELB"
  --metric-name HTTPCode_ELB_5XX_Count
  --dimensions Name=LoadBalancer,Value=app/my-alb/0123456789abcdef
  --statistic Sum
  --period 60
  --evaluation-periods 5
  --datapoints-to-alarm 3
  --threshold 25
  --comparison-operator GreaterThanThreshold
  --treat-missing-data notBreaching
  --alarm-actions arn:aws:sns:eu-west-1:111122223333:oncall-page
Read that as: over the last five minutes, if three or more individual minutes each saw more than 25 backend 5XX responses, page. Minutes with no data count as fine, because a load balancer with no errors publishes nothing.
Percentiles need a sample-count decision
Average latency hides everything interesting, so alarm on p95 or p99 using the extended statistic rather than --statistic Average.
The catch is low traffic. A p99 computed from four requests is noise, and by default CloudWatch still evaluates it. The EvaluateLowSampleCountPercentile setting controls that: set it to ignore and the alarm holds its current state when the sample count is too small to mean anything. On an overnight window or a quiet endpoint, that one setting removes a whole class of 4am pages.
Sliding versus wall clock windows
By default the evaluation window slides: it advances a minute at a time and is not aligned to the clock. That is what you want for latency and errors, because you want to know now.
CloudWatch also supports a wall clock window aligned to real boundaries in a time zone you pick: top of the hour, midnight, start of the calendar week. That is the right choice for anything measured per calendar period, like a daily batch job or a monthly threshold, because the alarm considers a completed period rather than a rolling one. Note that the wider evaluation range described earlier applies only to sliding windows, so wall clock alarms are easier to reason about but have no safety net for late-arriving data.
Alarming on the wrong number
A large share of useless alarms are correctly configured alarms watching a meaningless quantity.
Rates, not counts
An alarm on “more than 50 errors” is wrong twice. During a traffic peak, 50 errors out of half a million requests is nothing. At 3am, 50 errors out of 60 requests is a total outage that never crosses the threshold.
# m1 = Errors (Sum), m2 = Invocations (Sum)
# Guard the zero case so the alarm gets a data point at idle
# instead of a gap it has to interpret.
e1 = IF(m2 > 0, m1 / m2 * 100, 0)
Only the final expression should return data to the alarm; the underlying metrics are inputs. A rate alarm alone is still incomplete, though, because at very low volume one error is 100 percent. Pair it with a minimum-volume condition in a composite alarm, or fold the request count into the expression so tiny denominators cannot trip it.
Quotas and saturation, before they bite
Service quotas are the outage nobody sees coming, because everything is healthy right up until it is not. For services that publish usage metrics, the SERVICE_QUOTA metric math function pulls your current limit from Service Quotas, so you can alarm on percentage consumed instead of a number you hardcoded and forgot:
# m1 is a usage metric under the Usage namespace.
# Alarm on consumption as a share of the live quota.
e1 = m1 / SERVICE_QUOTA(m1) * 100
This is the definitive ticket-not-page alarm. Nobody needs waking for concurrency at 80 percent, but somebody needs to file a limit increase before the deploy that takes it to 100. Same category: queue age rather than queue depth. A deep queue draining fast is fine; a shallow queue whose oldest message is twenty minutes old means your consumers are stuck.
Cutting the storm: composite alarms, suppression and mute rules
One bad deploy in an Auto Scaling group with per-instance alarms produces forty notifications describing one event. A composite alarm evaluates a boolean rule over other alarms. The metric alarms stay exactly as they are and keep their own state, but stop being wired to your paging topic. The composite becomes the only thing that pages.
aws cloudwatch put-composite-alarm
  --alarm-name "checkout-degraded"
  --alarm-rule 'ALARM("checkout-latency-p99") AND ALARM("checkout-error-rate")'
  --alarm-actions arn:aws:sns:eu-west-1:111122223333:oncall-page
Latency alone might be a slow dependency. Errors alone might be a bad client. Both together is a real problem, and that is what earns a page.
The second half is suppression. A composite alarm accepts a suppressor alarm: while that alarm is in ALARM, the composite still evaluates but takes no actions. Point it at a deployment-in-progress alarm and you stop paging for known-bad windows.
aws cloudwatch put-composite-alarm
  --alarm-name "checkout-degraded"
  --alarm-rule 'ALARM("checkout-latency-p99") AND ALARM("checkout-error-rate")'
  --actions-suppressor "deployment-in-progress"
  --actions-suppressor-wait-period 60
  --actions-suppressor-extension-period 60
  --alarm-actions arn:aws:sns:eu-west-1:111122223333:oncall-page
Those two periods are the part people skip and then get burned by. The wait period gives the suppressor time to reach ALARM before the composite decides to fire; the extension period gives the composite time to settle back to OK after the suppressor clears. AWS suggests 60 seconds for each, on the reasoning that metric alarms evaluate once a minute. Leave them at zero and you get paged in the gap between the deploy starting and the deploy alarm noticing.
CloudWatch has since added alarm mute rules, which handle the scheduled case directly. A mute rule targets specific alarms by name and mutes their actions during a one-time or recurring window. The alarms keep evaluating and keep changing state; only the actions are muted. That removes the EventBridge and Lambda contraption teams used to build for maintenance windows. Two things to keep straight: mute rules take precedence over composite action suppression when both apply, and a mute rule targets alarms by name, so a rename in your Terraform or OpenTofu module silently orphans the rule.
Suppression is for known-bad windows you chose. If you are muting an alarm because it is annoying rather than because you scheduled the disruption, the alarm is wrong and muting it just hides that.
Test the path, not the threshold
An alarm you have never seen fire is a hypothesis. The threshold is the easy part. The fragile part is everything downstream: SNS subscriptions that were never confirmed, a Lambda whose role lost a permission, a chat webhook rotated three months ago, a topic policy that quietly rejects CloudWatch.
You can force a state transition without touching the metric:
aws cloudwatch set-alarm-state
  --alarm-name "api-5xx-elevated"
  --state-value ALARM
  --state-reason "Routing test, ticket OPS-1234"
This drives the real actions, so the page really goes out. Tell the on-call first. The forced state is temporary; the next real evaluation overwrites it. Do this for every new alarm before you call it done, and again after any change to the notification stack. On a mixed estate where some workloads sit on a VPS at a provider like Contabo or InterServer alongside your AWS footprint, test each path separately, because a shared SNS topic creates the illusion that one confirmed subscription covers everything.
Then confirm the transition and the action both happened:
aws cloudwatch describe-alarm-history
  --alarm-name "api-5xx-elevated"
  --history-item-type Action
  --max-records 10
What useful CloudWatch alarms cost you
Alarms bill per alarm metric per month, so the mental model that matters is this: a standard metric alarm counts as one, and a metric math alarm counts as one per metric referenced in the expression. An error-rate alarm built from errors and invocations bills as two, not one. Anomaly detection alarms carry their own multiplier because the band is evaluated alongside the metric. High-resolution alarms, with periods of 10, 20 or 30 seconds, are charged at a higher rate than standard ones, which makes them worth it for a handful of latency-critical paths and wasteful everywhere else.
Check current rates on the CloudWatch pricing page rather than trusting a number in a blog post, including this one. And note the bigger cost is usually not the alarm at all. It is the custom metrics feeding it, especially high-cardinality ones published per request or per container.
Troubleshooting an alarm that misbehaves
- Stuck in INSUFFICIENT_DATA. Either the metric is not being published, or the alarm’s dimensions do not match the metric’s dimensions exactly. Dimension mismatch is the common one and it is silent: an alarm on a dimension set that never existed looks identical to an alarm on a dead resource.
- Fired but nobody heard. Check
describe-alarm-historyfiltered to Action items. Transition present but action missing points at the SNS topic policy or the subscription. Both present points downstream of SNS. - Fires with no visible breach on the graph. Almost always missing data plus the wider evaluation range. The state reason names how many points were breaching and how many were unknown.
- Flapping between OK and ALARM. The period is too short for the metric’s natural variance, or data points to alarm equals evaluation periods. Widen the window before raising the threshold; raising the threshold loses sensitivity you may want later.
- Composite alarm never fires. Confirm every child alarm named in the rule exists and is spelled correctly, then confirm no suppressor or mute rule is active. The console shows a mute indicator on affected alarms.
Common mistakes
- Leaving
TreatMissingDataat the default because you did not know it existed. - Picking 80 percent CPU because it sounds like a threshold, on a service that normally runs at 75.
- Alarming per instance in an Auto Scaling group instead of on the aggregate a customer experiences.
- Wiring OK actions to the same paging channel, so every recovery is also an interruption.
- Alarm descriptions that restate the alarm name. The description is the only context the responder gets at 3am, so put the runbook link there.
- Anomaly detection on a metric with no stable pattern. The band is only as good as the history it learned from.
Best practices for useful CloudWatch alarms
- Set
TreatMissingDataexplicitly on every alarm, and write down why in the description. - Separate
DatapointsToAlarmfromEvaluationPeriods. M out of N is almost always better than N consecutive. - Observe a metric across a full weekly cycle before fixing its threshold. Weekend traffic is a different distribution.
- Define alarms in code, in whatever you already use: Terraform, OpenTofu, CDK, CloudFormation. Console-created alarms drift and disappear.
- Use anomaly detection for the signal and composite alarms for the logic. An anomalous shape plus real user impact is a page; an anomalous shape alone is a graph.
- Review what fired last quarter. Any alarm that fired and was closed without action is a candidate for deletion. Send it to a Grafana panel instead.
Frequently asked questions
How many CloudWatch alarms should a service have?
Fewer than you think. A handful of symptom alarms that page, plus a set of cause alarms that open tickets, covers most services. The number that matters is not how many exist but how many fired last quarter and led to somebody doing something.
Should I use anomaly detection or static thresholds?
Static thresholds where a real limit exists: a disk that must not fill, a latency budget you promised. Anomaly detection where the metric has a genuine daily or weekly shape and no fixed correct value, like request volume. Anomaly detection needs history before it is useful and struggles when a deploy changes the pattern, so it is a poor fit for anything new.
Why did my alarm fire when the graph looks fine?
Usually missing data. CloudWatch pulls a wider evaluation range than the periods you configured, so an older breaching point can still count while newer points are simply absent. Read the state reason, which spells out how many points were breaching and how many were unknown, then reconsider the missing-data setting.
Can an alarm watch a metric in another AWS account?
Cross-account observability lets a monitoring account view and alarm on metrics from linked source accounts, which is the usual pattern for an AWS Organizations estate. The alternative is running alarms in each account and aggregating at the SNS or paging layer. That is more alarms to manage but keeps the blast radius per account smaller.
How do I stop alarms firing during a deployment?
Two options. An alarm mute rule on a schedule, if your deploys are predictable. Or a composite alarm with a deployment-in-progress alarm as its actions suppressor, if they are not. The suppressor approach suits continuous delivery better because it reacts to the actual deploy rather than a calendar guess.
Do CloudWatch alarms work on logs?
Indirectly. A metric filter on a log group turns matching log lines into a numeric metric, and you alarm on that metric like any other. Metric filters only emit data points when they match, so notBreaching is almost always the right missing-data setting for them.
Is CloudWatch enough, or do I need Datadog or Grafana?
For a single-account AWS workload, CloudWatch alarms plus SNS handle alerting fine, and staying inside AWS avoids another integration to maintain. Third-party platforms earn their keep when you need correlation across non-AWS systems, richer on-call routing, or long metric retention with fast queries. The honest test is whether you are already spending engineering time rebuilding those features on top of CloudWatch.
The one thing to keep
Useful CloudWatch alarms are not the ones with the cleverest thresholds. They are the ones where somebody decided, on purpose, what silence means.
Every alarm in your account is making a claim about the absence of data, whether you configured that claim or inherited it. Go through them, set TreatMissingData deliberately, split data points from evaluation periods, delete the ones nobody acts on, and force a state transition on the ones you keep so you know the page lands. Six alarms that fire correctly beat sixty that nobody reads.
Need a second pair of eyes on your alerting?
I work with teams on AWS monitoring that people actually trust. Typically that looks like:
- Auditing existing CloudWatch alarms and separating the ones that page, the ones that should open tickets, and the ones to delete.
- Fixing missing-data and evaluation settings so alarms stop firing on gaps and stop going silent on dead metrics.
- Building composite alarms, suppression and mute rules so one incident produces one page instead of forty.
- Writing metric math for error rates, queue age and quota headroom instead of raw counts.
- Codifying the whole alarm set in Terraform or OpenTofu so it survives the next person.
- Wiring CloudWatch into Grafana dashboards and testing every notification path end to end.
If you want a concrete starting point, send me the output of describe-alarms for one account and I will tell you which alarms are load-bearing and which are decoration.