A colleague messages you: “checkout fell off the service map.” The service is fine. It’s serving traffic, the collector pod is Running, the exporter queue is empty, and nothing in the collector log reads like an error. But a chunk of the spans that left the application never showed up in CloudWatch.
That’s the signature failure of telemetry pipelines on AWS. Transport worked, authentication worked, the endpoint answered 200. It kept part of the payload and dropped the rest, because something in the batch broke a limit your collector has no idea exists.
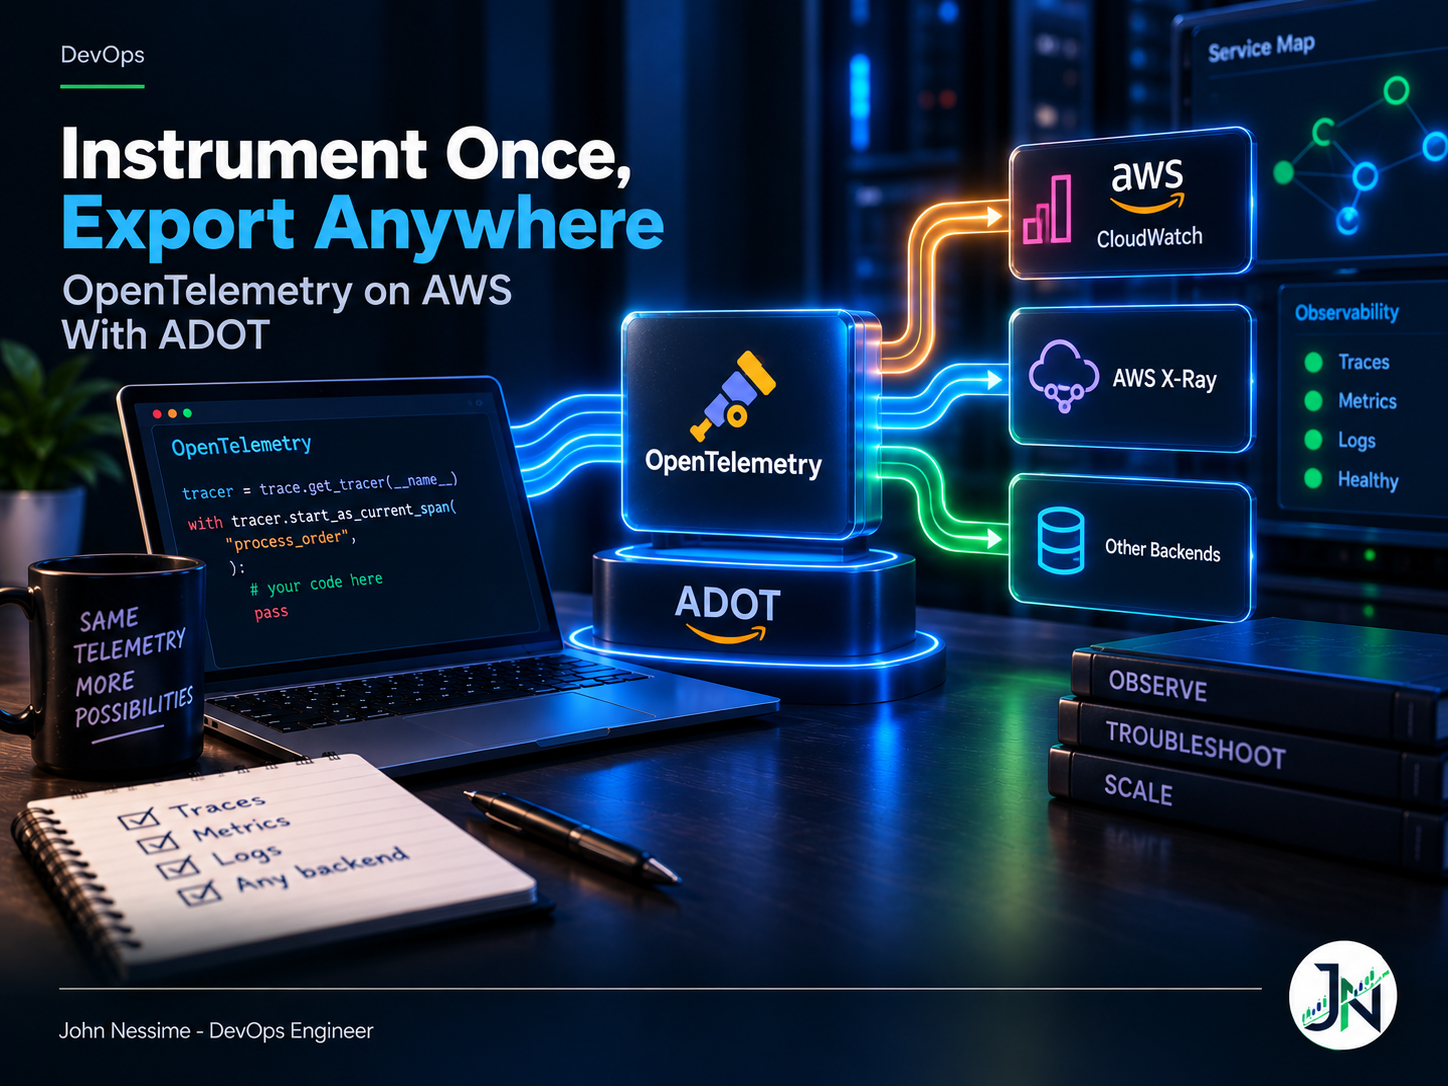
Getting started with OpenTelemetry on AWS is not the hard part. AWS Distro for OpenTelemetry (ADOT) will have you shipping traces in an afternoon. The hard part is four decisions underneath it: where the collector sits, which door telemetry uses to get into AWS, what happens to your metrics on the way through, and whether a second backend later costs you a config line or a migration. This post covers those four decisions and how each one fails without announcing itself.
What ADOT actually buys you
ADOT is not a separate protocol or agent. It’s a downstream build of the upstream OpenTelemetry Collector plus AWS-flavoured SDKs, tested by AWS and covered by AWS Support. The config syntax is the upstream syntax, so a config written for vanilla OTel runs on ADOT and vice versa. The difference is which components are compiled in: ADOT ships the X-Ray exporter, the CloudWatch EMF exporter, the SigV4 extension, and ECS metric receivers already there.
So the choice is narrower than it looks. Take ADOT for a build someone else validates and supports. Take upstream Contrib if you need a component ADOT hasn’t bundled, or you run one collector image across AWS, another cloud, and bare metal. Neither choice touches your instrumentation, which is the entire point.
Decision one: where the collector runs
Three shapes, trading the same three things: blast radius, cost, and how much processing happens before data leaves your network.
Sidecar
One collector container per ECS task or pod. The application talks to localhost, so no service discovery and no network hop to get wrong, and failure stays contained to one workload. The cost: you pay for that container everywhere, batches stay small because batching is per-instance, and any config change is a redeploy of every task.
Agent plus gateway
A light collector per node (a DaemonSet on EKS) forwarding to a small pool of gateways. This is the shape I reach for first on anything past a handful of services. The agent does host-level enrichment, the gateway does the expensive work: large batches, tail sampling, redaction, fan-out. Config changes hit the gateway only.
The catch: a gateway pool is a thing you now operate. It needs autoscaling and its own alerting, and undersized it starts refusing data at exactly the moment you have an incident and volume spikes.
No collector at all
The ADOT SDKs can export straight to the CloudWatch OTLP endpoints, signing requests with credentials already available to the process. For a handful of Lambda functions this is the right answer: nothing to run, nothing to scale, no extra container in the cold start path. What you give up is control. Batching, retries, sampling policy, redaction, and backend routing all move into application processes and their environment variables, so changing any of them is a fleet redeploy rather than a config push. Good starting point, poor steady state.
Decision two: which door into AWS
Two ways to hand telemetry to AWS, and they behave very differently.
The older path uses AWS-specific exporters. awsxray converts OTLP spans into X-Ray segment documents and calls the X-Ray API. awsemf converts OTLP metrics into CloudWatch Embedded Metric Format and writes them as log events. Both work, both are well trodden, and both reshape your data into an AWS-native format on the way out.
The newer path is native OTLP. CloudWatch exposes OTLP endpoints per signal, reached with the plain otlphttp exporter and a SigV4 signer. Same exporter you’d point at Grafana Cloud or Honeycomb, different URL and authenticator. That’s what “export anywhere” means in practice, and it’s why I default to it on new work.
The endpoints follow a per-service pattern:
- Traces:
https://xray.<region>.amazonaws.com/v1/traces - Metrics:
https://monitoring.<region>.amazonaws.com/v1/metrics - Logs:
https://logs.<region>.amazonaws.com/v1/logs
Three constraints there will each cost you an afternoon if you don’t know them going in.
HTTP only. No gRPC. If your collector exports over otlp on 4317 you can’t just change the URL, you have to switch exporters. Receiving gRPC from applications is fine, it’s the outbound leg that must be HTTP.
SigV4 required. That means the sigv4auth extension, configured per signal because the signing service name differs: xray, monitoring, and logs respectively. Bearer tokens are an alternative for metrics and logs, but not for traces.
Logs need headers, not just a URL. Target log group and stream travel in x-aws-log-group and x-aws-log-stream headers. Omit them and the request has nowhere to land.
A working shape for traces and logs looks like this:
extensions:
  sigv4auth/traces:
    region: "us-east-1"
    service: "xray"
  sigv4auth/logs:
    region: "us-east-1"
    service: "logs"

exporters:
  otlphttp/traces:
    compression: gzip
    traces_endpoint: https://xray.us-east-1.amazonaws.com/v1/traces
    auth:
      authenticator: sigv4auth/traces

  otlphttp/logs:
    compression: gzip
    logs_endpoint: https://logs.us-east-1.amazonaws.com/v1/logs
    headers:
      x-aws-log-group: MyApplicationLogs
      x-aws-log-stream: default
    auth:
      authenticator: sigv4auth/logs

service:
  extensions: [sigv4auth/traces, sigv4auth/logs]
  pipelines:
    traces:
      receivers: [otlp]
      exporters: [otlphttp/traces]
    logs:
      receivers: [otlp]
      exporters: [otlphttp/logs]
Note traces_endpoint and logs_endpoint rather than endpoint. This one bites people. The endpoint setting is a base URL and the exporter appends the signal path itself, so endpoint: https://monitoring.us-east-1.amazonaws.com/v1/metrics actually requests /v1/metrics/v1/metrics. The per-signal settings take a full path. If you’re getting 404s from a URL you’re certain is right, this is why.
Also worth a comment in your config: upstream has renamed the component to otlp_http and otlphttp is now a deprecated alias scheduled for removal. Both work today.
Traces need Transaction Search turned on first
This is the single most common reason a correctly configured trace pipeline produces nothing. The X-Ray OTLP endpoint requires Transaction Search to be enabled on the account, which redirects span ingestion into CloudWatch Logs:
aws xray update-trace-segment-destination --destination CloudWatchLogsSpans then land in a log group named aws/spans, with a percentage indexed in X-Ray as trace summaries for search. The default index rate is one percent, enough to find traces while all spans stay queryable as structured logs. The caller needs xray:UpdateTraceSegmentDestination and xray:UpdateIndexingRule plus log group creation rights.
Two consequences to plan for. Span ingestion is billed separately from log ingestion, so it’s a line item rather than a rounding error. And AWS recommends always_on sampling in the SDK on this path, because the indexing rule already handles reduction. Sample in both places and your service map goes patchy.
The X-Ray SDK clock is running
The dates matter here, so plainly: the X-Ray SDKs and daemon entered maintenance mode on 25 February 2026 (security fixes only, no new instrumentation support), with end of support on 25 February 2027. The X-Ray service is fine and still gaining features. It’s the client libraries and the UDP daemon winding down. If you run aws-xray-sdk and a daemon sidecar, that is technical debt with a published expiry, and either the collector or the CloudWatch agent replaces the daemon.
Decision three: metrics, temporality, and the cardinality bill
Metrics are where the silent drops live, because collector defaults and endpoint limits disagree.
The metrics endpoint caps a single request at 1 MB uncompressed and 1,000 datapoints, counted across resource, scope, and metric levels combined. The upstream batch processor’s default is far larger. Leave it alone and you build oversized requests, and the response to an oversized or partially invalid request is not always a clean failure: it can come back 200 with some metrics accepted and others rejected or throttled. So set the batch size deliberately. AWS’s own examples use a conservative value:
processors:
  batch:
    send_batch_size: 200
    timeout: 10s
The other limits shape attribute design more than config:
- 150 labels maximum across resource, scope, and datapoint attributes per datapoint
- 40 KB combined label and value size per series per datapoint
- One million new series creatable per ten-minute window, per account
- Timestamps no more than ten minutes in the future or fourteen days in the past
That new-series ceiling catches teams out. Attach a request ID, a session ID, or a raw URL path to a metric attribute and every request mints a fresh series. You’ll hit a million faster than you expect, and it presents as metrics randomly going missing rather than a quota error. Unbounded identifiers belong on spans and logs. Metric attributes should be values you could enumerate on a whiteboard.
Temporality is the other conscious decision. The OpenTelemetry SDK spec defaults to cumulative, while CloudWatch’s metric model is delta-shaped: it wants what happened this period, not the total since your process booted. Counters that look like ever-climbing staircases instead of rates are that mismatch. The cumulativetodelta processor converts in the pipeline, keeping the decision in the collector rather than scattered across SDK environment variables in every service.
Decide once and centrally either way. Mixed temporality across one account produces dashboards that are subtly wrong for months before anyone notices. And once volume climbs, pointing a cost tool such as Vantage or CloudZero at the CloudWatch line items earns its setup time, because telemetry spend grows in steps nobody approved.
Decision four: a second backend without a second instrumentation
Here’s the payoff. A collector pipeline holds multiple exporters, and adding one is a config change:
service:
  pipelines:
    traces:
      receivers: [otlp]
      processors: [batch]
      exporters: [otlphttp/traces, otlphttp/vendor]
The same spans now reach CloudWatch and Grafana Cloud, Honeycomb, Datadog, or a self-hosted Tempo, with no application redeploy and no second agent. That’s the cashable value of instrumenting once against an open protocol: the switching cost of a backend drops from a migration project to a pull request.
Be honest about the price. You pay ingest twice, and egress from the gateway is real money at volume. Collector memory scales with exporter queue count, so a fan-out gateway needs headroom. And if one backend slows, backpressure can reach the pipeline feeding the other, which argues for separate pipelines per destination when their reliability differs.
It works in reverse too. Because the metrics and logs endpoints accept bearer tokens, a machine with no AWS credentials at all can ship into CloudWatch: a CI runner, another cloud, or a VPS at a provider like Contabo or InterServer running part of your stack. One collector config, one destination, regardless of who owns the hardware. Traces are the exception and still require SigV4.
Why OpenTelemetry on AWS fails quietly
Most breakages here don’t throw. How to recognise the common ones:
Data is missing but nothing errors
Almost always a limit breach inside an accepted request. Check batch sizes against the per-signal caps first, then attribute counts. Turn on the collector’s internal telemetry and compare the exporter’s sent counters against its failed counters. If sent looks healthy and data is still missing, the loss is happening server-side after acceptance, which narrows it to limits.
403 with a signature mismatch
A SigV4 problem, not an IAM problem. The usual cause is the wrong signing service name in the extension, since xray, monitoring, and logs are not interchangeable. If you sign requests yourself rather than using the extension, note that the traces endpoint is stricter about which headers land in the signed set, so sign a minimal stable set rather than everything the HTTP client added.
Backfilled data vanishes
Every endpoint enforces a timestamp window, and fourteen days in the past is the outer edge for all three signals. Replaying an old queue past that boundary gets rejected. Not a bug, but it looks like one when the replay job appears to succeed and produces nothing.
Traces arrive but the service map is empty
Usually a missing or inconsistent service.name resource attribute, or double sampling between the SDK and the indexing rule. Confirm what’s actually leaving the collector before hunting in the console: add the debug exporter to a copy of the pipeline, set verbosity: detailed, and read the resource attributes on real spans.
Common mistakes
- Pointing an OTLP gRPC exporter at a CloudWatch endpoint. They’re HTTP only, and the error won’t say so clearly.
- Using
endpointwith a full signal path instead of the per-signaltraces_endpoint,metrics_endpoint, orlogs_endpoint. - Leaving the batch processor at its default size on the metrics pipeline.
- Sampling in the SDK and relying on Transaction Search indexing rules, halving visibility twice over.
- Putting request IDs, user IDs, or raw paths into metric attributes.
- Running a gateway pool with no alerting on the collector’s own health, so saturation is invisible until you need it.
Best practices
- Keep instrumentation vendor-neutral. Plain OpenTelemetry SDK APIs, with the collector owning every AWS-specific decision.
- Set
service.name,service.version, anddeployment.environmentas resource attributes everywhere. Almost every correlation feature depends on them. - Alert on exporter failure counters and queue depth, and route those alerts somewhere that doesn’t depend on the pipeline being healthy.
- Version the collector config in Git and deploy it like application code, with a staging pipeline you can break safely.
- Redact in a processor before export. Once telemetry reaches a backend, removing it is a support ticket.
- Test a second exporter early, even to a throwaway account. A vendor migration is the wrong time to learn the fan-out path doesn’t work.
Frequently asked questions
Do I still need a collector if CloudWatch accepts OTLP directly?
Not to get data in, no. You need one to control what happens before it leaves: batching to fit endpoint limits, tail sampling, redaction, and fan-out. Small serverless estates can reasonably skip it. Anything with a dozen services will want one.
Can I send OTLP to CloudWatch over gRPC?
No. The CloudWatch OTLP endpoints are HTTP 1.1 only, accept binary or JSON payloads, and support gzip or no compression. Your collector can still receive gRPC from applications, it just can’t forward over it.
What’s the difference between ADOT and the upstream collector?
Same codebase, different build. ADOT is AWS’s tested distribution with AWS components bundled and AWS Support behind it; upstream Contrib carries a wider component set and moves faster. Configuration is compatible either way, so it’s a support and packaging choice, not an architectural one.
Do I have to enable Transaction Search to send traces?
For the X-Ray OTLP endpoint, yes. It’s a prerequisite, and enabling it routes span ingestion through CloudWatch Logs. Using the awsxray exporter against the classic X-Ray API instead doesn’t require it, but you give up the span-level analytics Transaction Search provides.
Can I ship telemetry to CloudWatch from outside AWS?
For metrics and logs, yes, using bearer token authentication instead of SigV4, which removes the need for AWS credentials on the host. Traces still require SigV4. Never hardcode the token in the config; read it from a mounted secret file or an injected environment variable.
Is it urgent to migrate off the X-Ray SDK?
Not an emergency, but it’s on a clock: maintenance mode now, end of support 25 February 2027. Existing applications keep working, they just won’t get new library instrumentation. Plan the migration on your schedule rather than someone else’s.
The one thing worth remembering
A pipeline that returns 200 is not a pipeline that works. Judge every design decision in OpenTelemetry on AWS against one question: when this drops data, do I find out from a dashboard or from a colleague asking why a service vanished off the map?
Size batches against the published limits, keep unbounded identifiers off metric attributes, decide temporality in one place, and instrument with plain OpenTelemetry so the export target stays a config line. Do that and “instrument once, export anywhere” stops being a slogan and becomes a property you can test.
Need help with your OpenTelemetry pipeline on AWS?
Most of this work is unglamorous and specific, which is why it gets deferred. Things I can help with:
- Auditing an ADOT or upstream collector config for silent drops, oversized batches, and limit breaches
- Designing collector topology for ECS, EKS, or Lambda, including gateway sizing and autoscaling
- Migrating X-Ray SDK and daemon workloads to OpenTelemetry ahead of end of support
- Cutting telemetry spend through sampling policy, cardinality control, and attribute pruning
- Dual export to CloudWatch and a third-party backend, so a future switch is a config change
- Meta-monitoring that tells you the pipeline is broken before your users do
Send me a collector config, an exporter log, or a screenshot of the gap in your dashboard and I’ll tell you what I’d look at first.