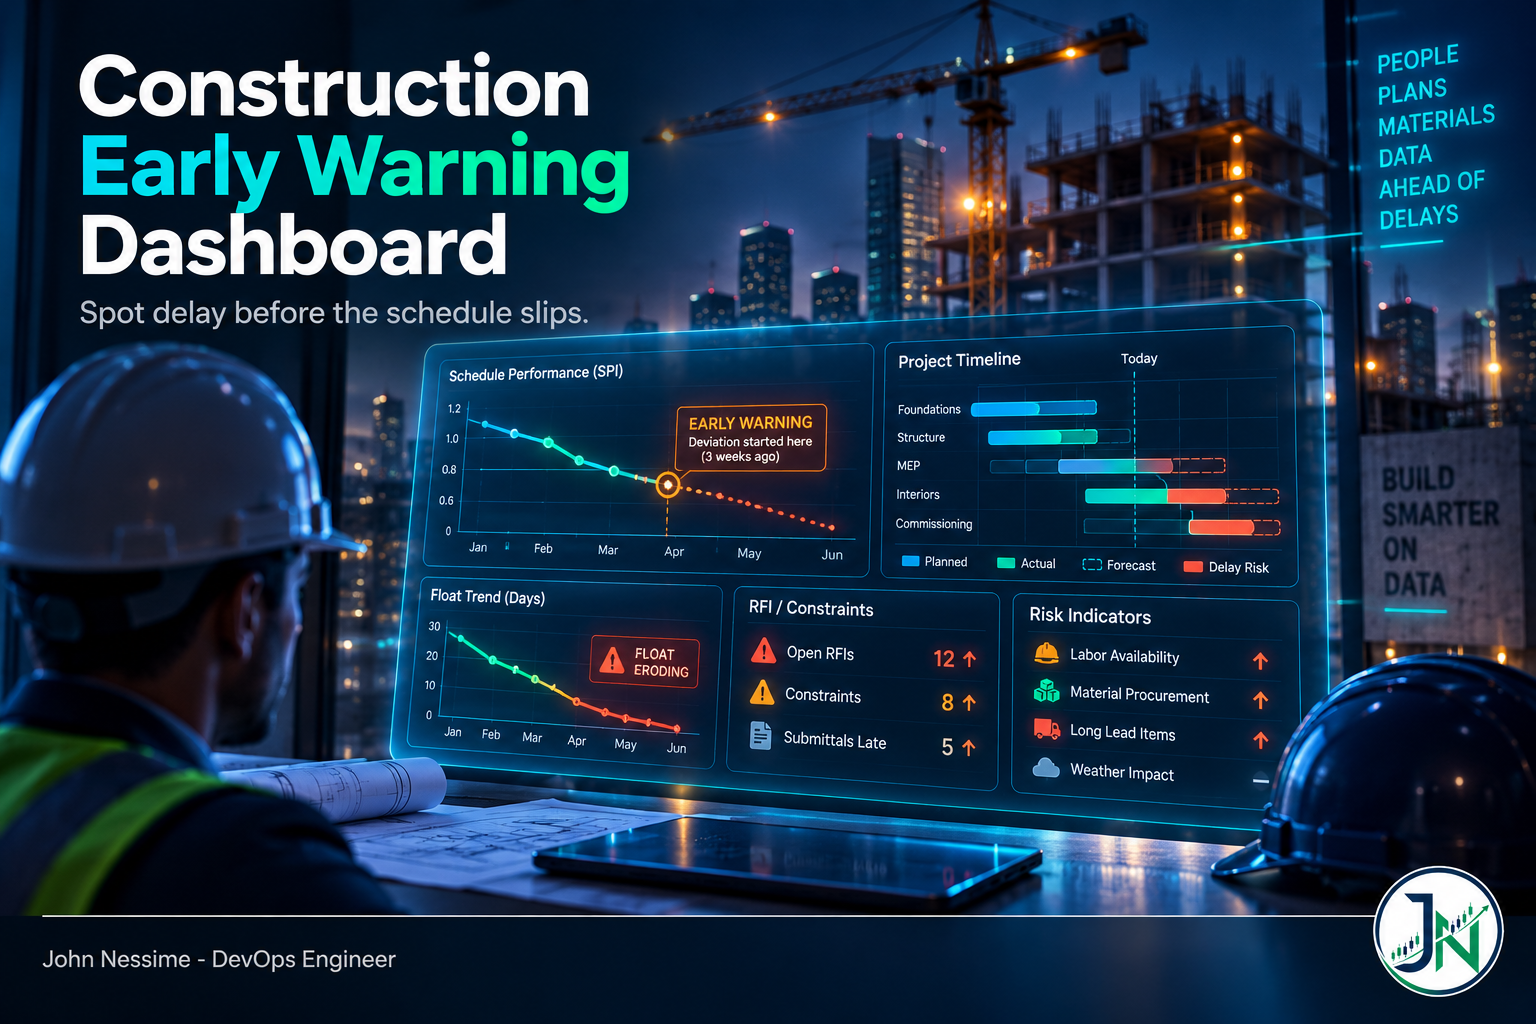
The Delay Was in the Data Three Weeks Ago: Building a Construction Early Warning Dashboard

Schedule delay rarely arrives as a surprise. It sits in float erosion, aging RFIs and slipping weekly commitments long before the monthly update moves the finish date. Here is how to build a dashboard that catches it while there is still float left to spend.
Continue ReadingThe Delay Was in the Data Three Weeks Ago: Building a Construction Early Warning Dashboard

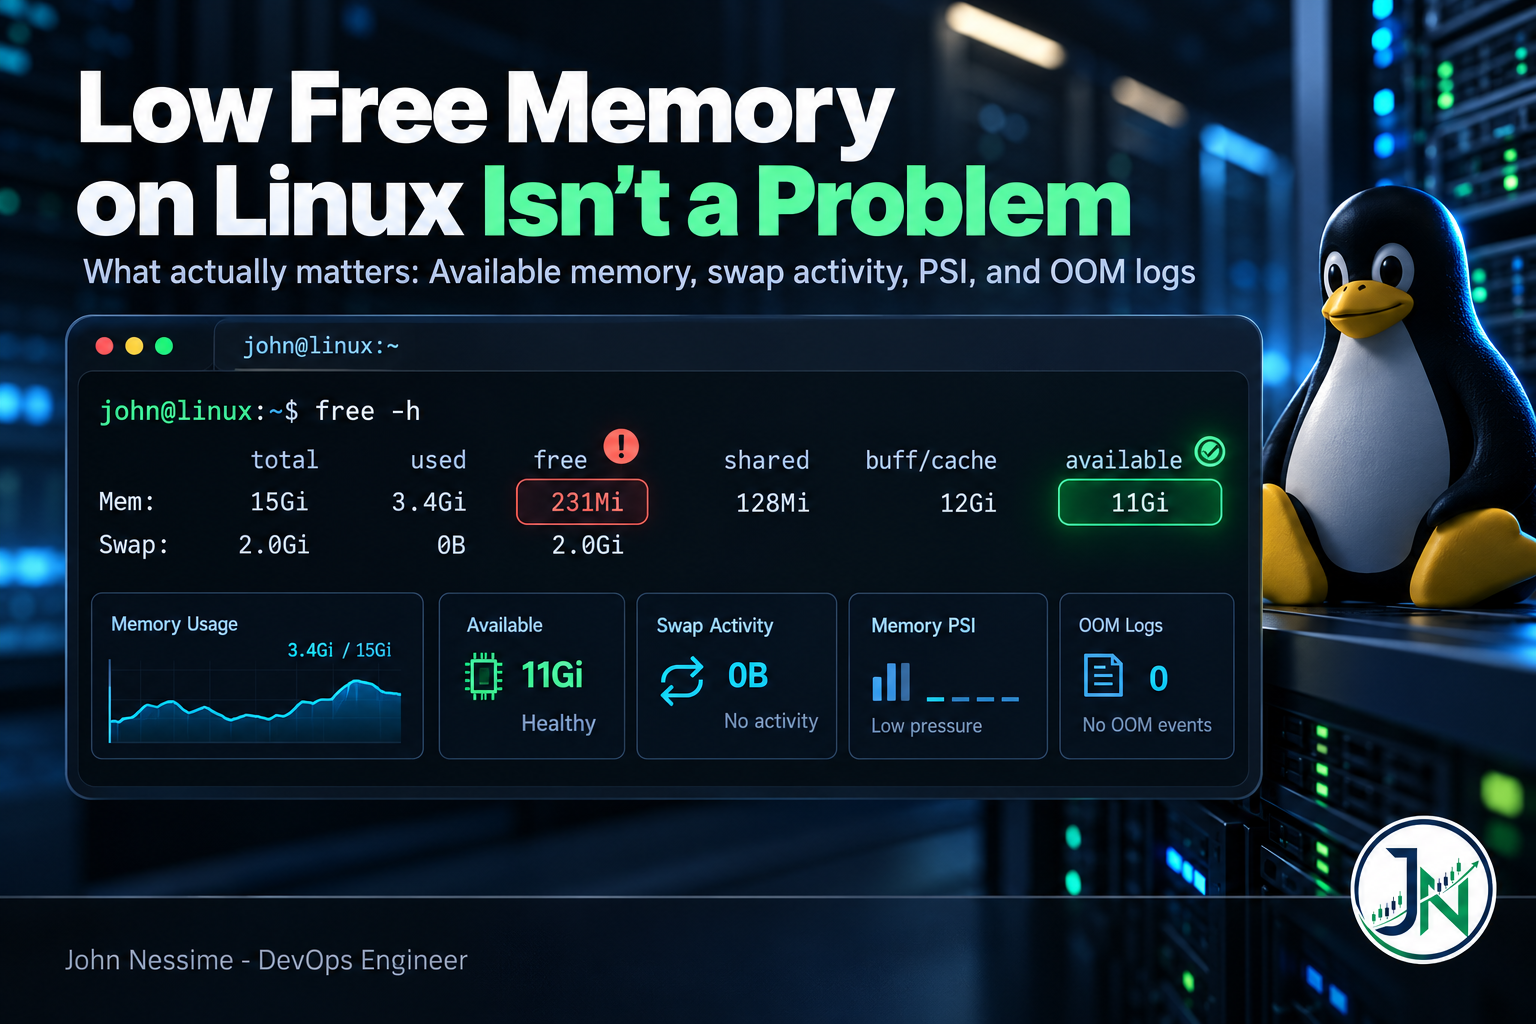
Low Free Memory on Linux Isn’t a Problem. Here’s What Actually Is.

A screenshot of free -h showing 200 MB free triggers more unnecessary change requests than almost any other output in server operations. Here is what the free command is really reporting, why the available column is the one that matters, and the four signals that actually tell you a machine is running out of memory: available, swap rate, pressure stall information and the OOM log.

Continue ReadingLow Free Memory on Linux Isn’t a Problem. Here’s What Actually Is.

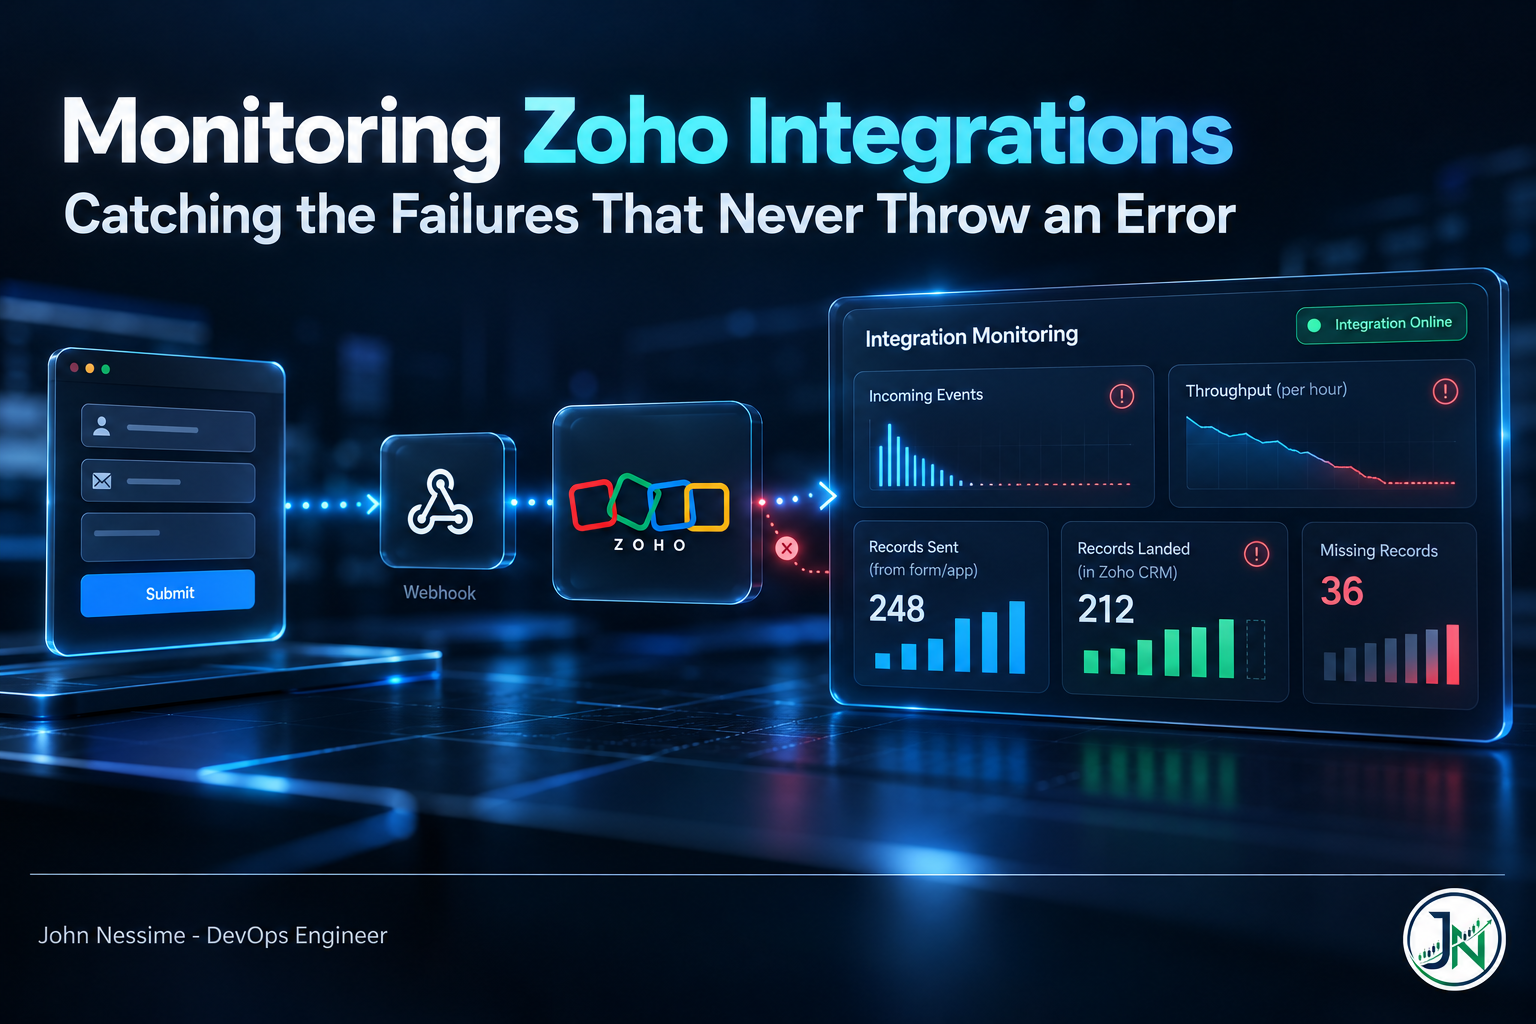
Monitoring Zoho Integrations: Catching the Failures That Never Throw an Error

Zoho integrations rarely fail loudly. Channels expire after an hour, credits drain against a rolling window, and bulk writes return HTTP 200 while rejecting records. Here is how to instrument for absence using CloudWatch Embedded Metric Format, Loki's absent_over_time, and Grafana across both.

Continue ReadingMonitoring Zoho Integrations: Catching the Failures That Never Throw an Error

Grafana Alert Notifications That Actually Arrive: Email, Slack and Telegram

The rule went red at 02:04 and nobody found out until 09:15. Rule evaluation and notification delivery are two different systems, and only one of them is visible in the UI. A practical setup for Grafana alert notifications to email, Slack and Telegram, plus how to detect the day delivery quietly stops.

Continue ReadingGrafana Alert Notifications That Actually Arrive: Email, Slack and Telegram

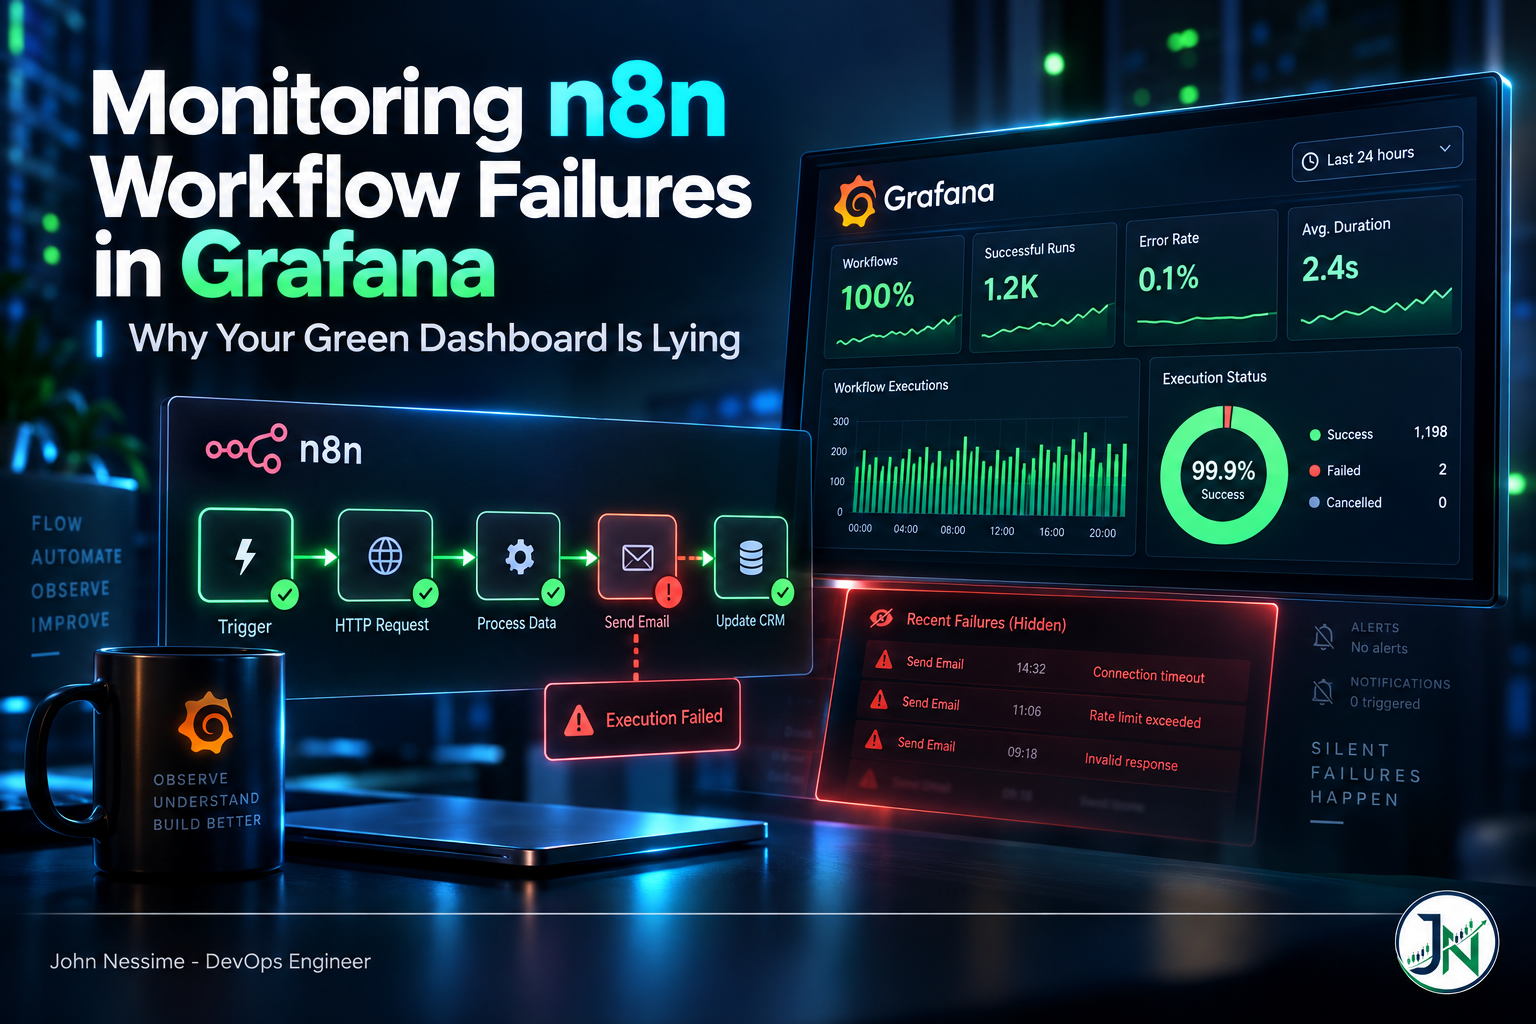
Monitoring n8n Workflow Failures in Grafana: Why Your Green Dashboard Is Lying

n8n's Prometheus endpoint tells you the process is alive and busy. It does not tell you a workflow stopped producing correct output. This post walks through the three failure families that slip past a default n8n dashboard, the PromQL that catches each one, and how to close the gap with a second source of truth from the executions API.

Continue ReadingMonitoring n8n Workflow Failures in Grafana: Why Your Green Dashboard Is Lying

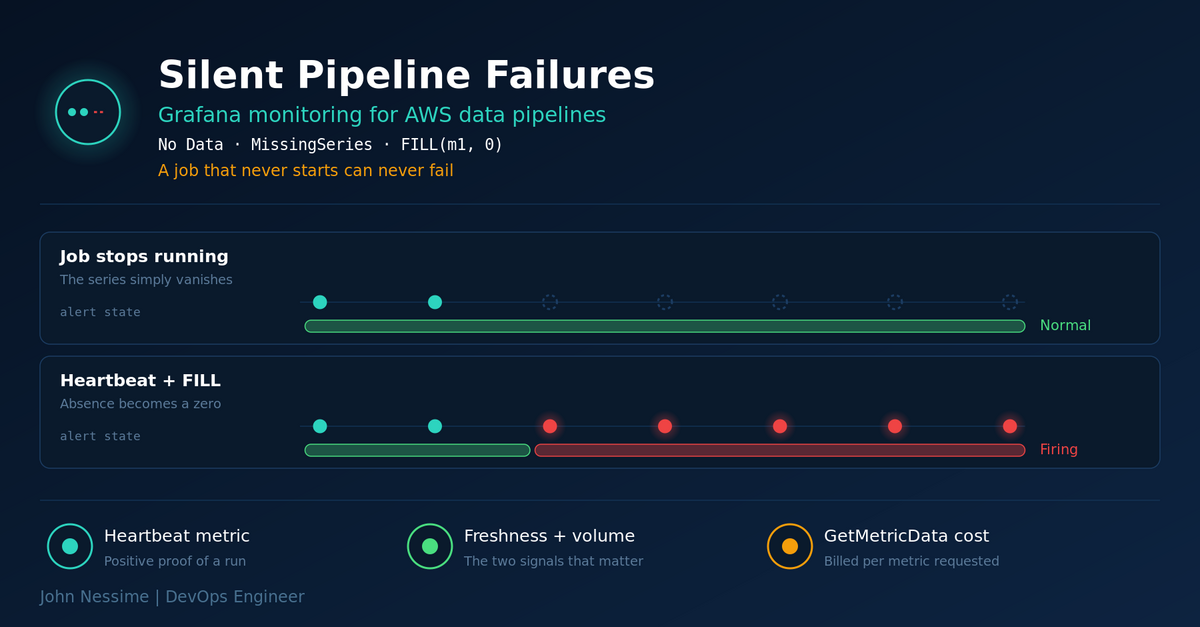
Grafana Monitoring for AWS Data Pipelines: The Green Dashboard Problem

A Glue job that stops running emits no metrics, so the dashboard stays green and the alert quietly resolves itself. Here is why Grafana monitoring for AWS data pipelines misses that failure, and the heartbeat, metric math and no-data configuration that closes the gap, along with the CloudWatch query costs and IAM boundaries nobody warns you about.

Continue ReadingGrafana Monitoring for AWS Data Pipelines: The Green Dashboard Problem

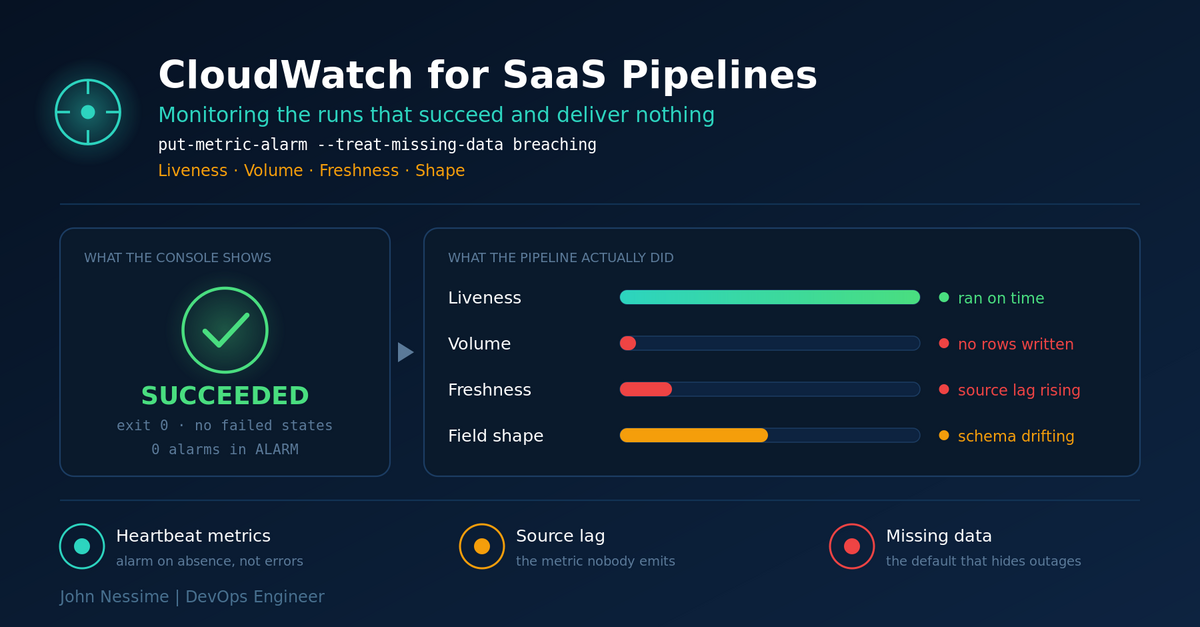
CloudWatch Data Pipeline Monitoring: Catching the Runs That Succeed and Deliver Nothing

Your SaaS pipeline will fail far more often by succeeding at nothing than by throwing an exception, and every CloudWatch default treats an absent metric as a non-event. Here are the four signals worth alarming on: liveness, volume, freshness and shape, plus the missing-data traps that leave alarms permanently green.

Continue ReadingCloudWatch Data Pipeline Monitoring: Catching the Runs That Succeed and Deliver Nothing