It Works Isn’t Ready: A Production Checklist for Salesforce AWS Integrations
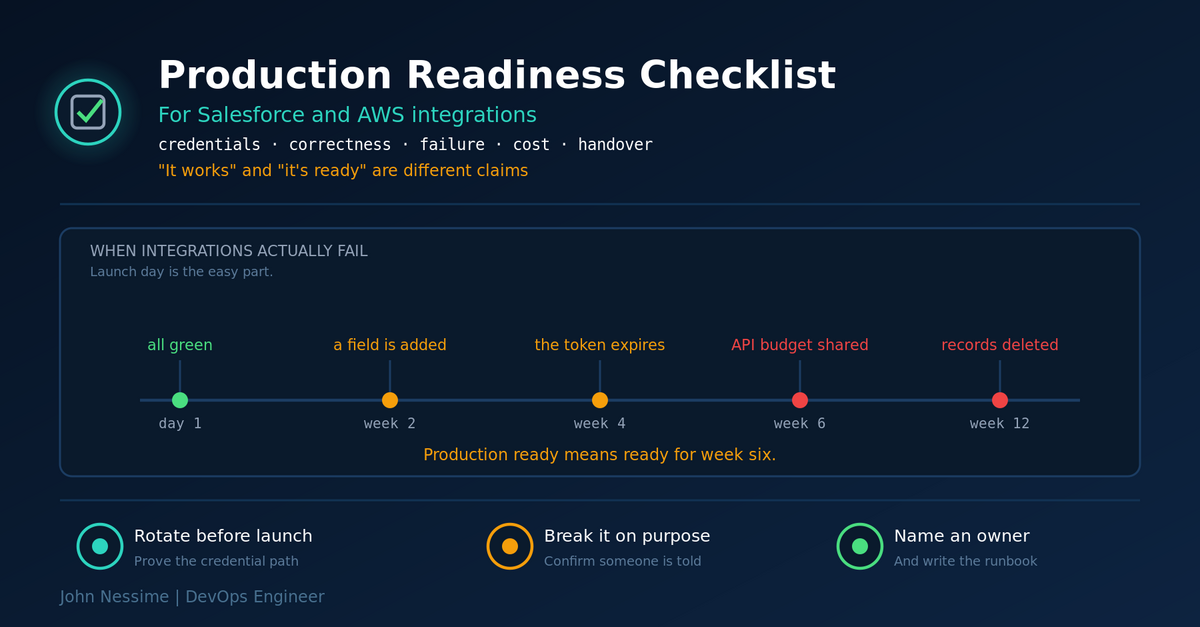
"It works" and "it's ready" are different claims. Integrations rarely fail on launch day; they fail in week six, when the token expires and someone adds a field. A readiness checklist for Salesforce AWS integrations, with a pass test on every item.