The request usually arrives with a deadline already attached. Finance bought Tableau licences, the growth team wants Power BI pointed at the clickstream data, and someone in a meeting said the data is “already in S3, so it should be quick.”
It is quick. You can have a working connection inside an hour. What isn’t quick is everything that surfaces three weeks later, when forty people are refreshing dashboards on a schedule nobody on your team controls and the Athena line on the invoice has quietly tripled.
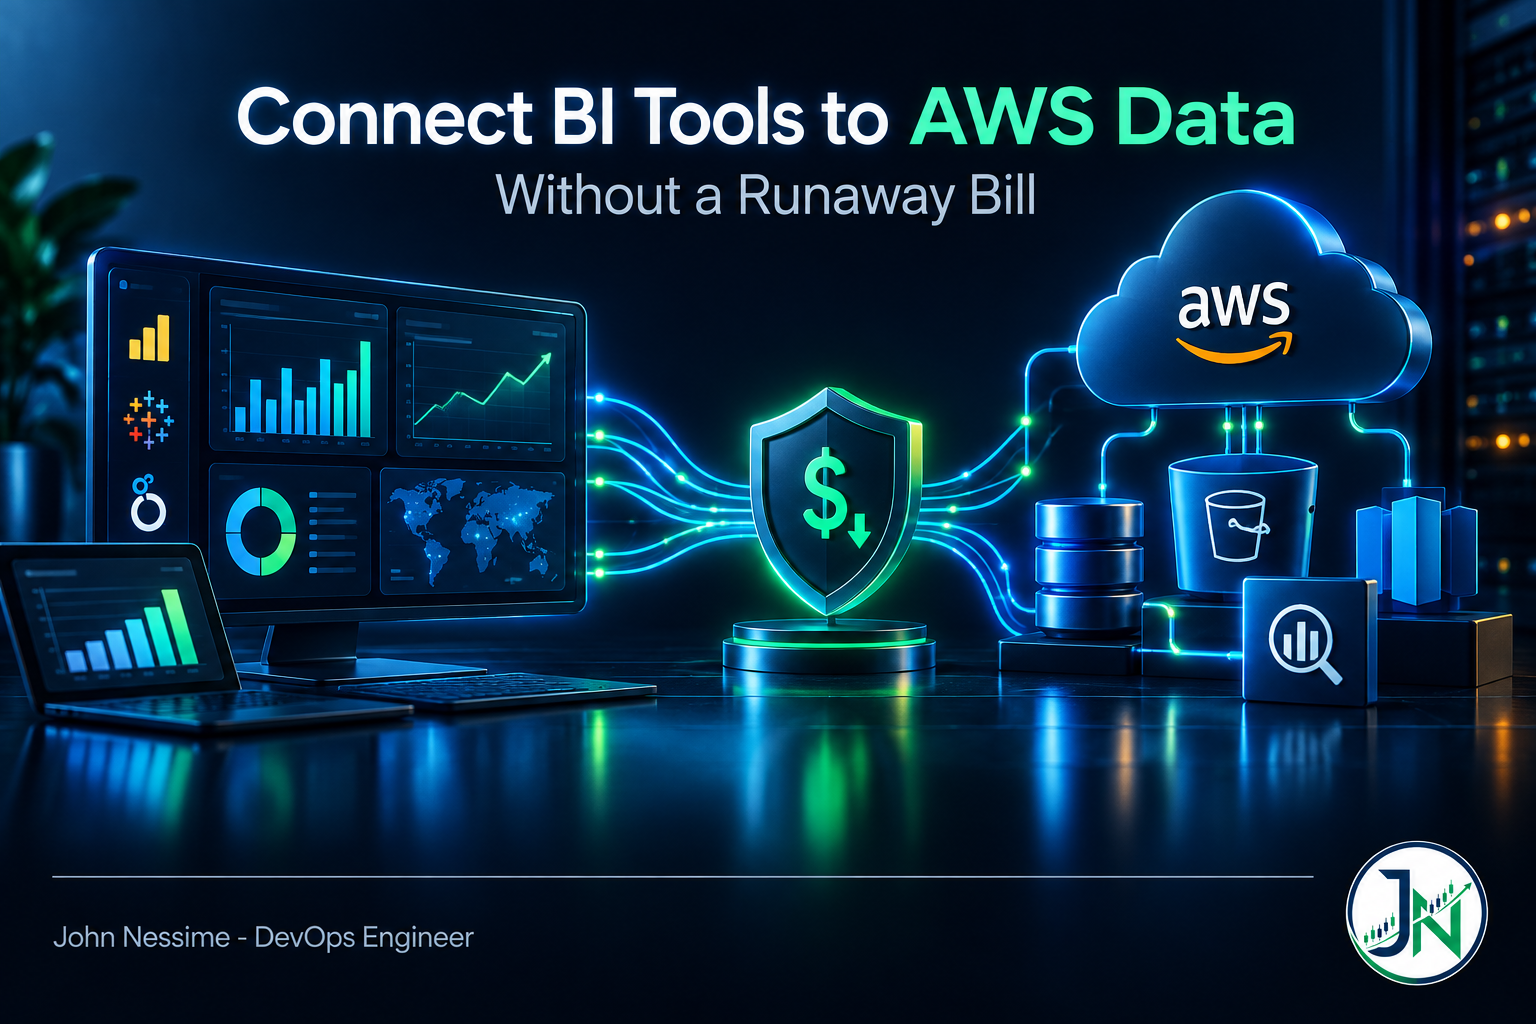
Getting a BI tool to authenticate against AWS and return rows is a solved problem with decent vendor documentation. What is not well covered is what happens afterwards. This post covers how to connect BI tools to AWS data in a way that survives contact with real users: the four access patterns worth considering, why fine-grained security and cheap dashboards pull in opposite directions, how identity actually flows through a shared service account, and the cost levers in the order they pay off.
The failure that shows up on the invoice, not in the logs
Start with the shape of the problem, because it explains most of the design decisions that follow.
A dashboard is not one query. Every tile is a query. A twelve-tile dashboard opened by forty analysts, with an hourly scheduled refresh on top, is a query generator running against your data lake. Athena bills on bytes scanned, so the cost of that pattern is set almost entirely by how much data each tile touches, not by how “small” the answer looks in the browser.
Athena has a feature built for exactly this. Query result reuse lets a repeated query return the previous stored result instead of scanning again, within a maximum age you choose. If you don’t specify an age, Athena treats results older than 60 minutes as expired, and the longest age you can specify is the equivalent of seven days.
Here is the part that catches people, and it is the whole reason I wrote this post.
Result reuse is not available for tables that have Lake Formation row or column filters. It is also unavailable when the table’s S3 location is registered as a Lake Formation data location, for queries that reference more than one data catalog, for queries referencing more than twenty tables, and for federated catalogs or an external Hive metastore.
So the sequence goes like this. Dashboards are connected and cheap. A security review asks for row-level security on the customer dimension. You add Lake Formation data filters, which is exactly the right call. Everyone signs off. And the reuse rate on those tables silently drops to zero. No error. No alert. No code change. Just a larger bill the following month and a very awkward conversation about what changed.
You can still have both governance and cheap dashboards. You just can’t have both on the same table. The usual escape is to materialise pre-filtered, per-audience tables that carry no filters of their own, and grant access to those instead. That costs you a pipeline and some storage. It buys back the caching.
Pick the door before you pick the driver
Most guides start with driver installation. That’s backwards. The driver is a twenty-minute job once you’ve decided which door the BI tool walks through. There are four realistic doors, and they fail in different ways.
Athena over the AWS Glue Data Catalog
The default, and usually the right first answer. Files stay where they are, the Glue Data Catalog is the single source of truth for schema, and anything that speaks JDBC or ODBC can connect. Tableau, Power BI, Looker, Metabase, Apache Superset and Grafana all handle this without exotic configuration.
Where it wins: no cluster to size, no idle spend, and you can expose a new dataset by cataloguing it rather than by loading it anywhere.
Where it doesn’t: per-query billing punishes chatty dashboards, and interactive latency is measured in seconds rather than milliseconds. If your users expect a filter dropdown to respond instantly, they will be disappointed and they will tell you so.
One practical note that saves an afternoon: for Tableau Desktop, the Athena JDBC driver has to be dropped in a specific directory before the connector appears. On macOS that’s ~/Library/Tableau/Drivers, and on Windows it’s C:Program FilesTableauDrivers. If the analyst says “I don’t see Amazon Athena in the list,” that’s almost always why.
A Redshift datashare into a consumer warehouse
If the data already lives in Redshift, or if concurrency is the binding constraint, a datashare is the cleaner answer. The producer keeps ownership; the consumer gets live, transactionally consistent access and pays with its own compute, so a badly written dashboard can’t degrade your ETL warehouse.
-- On the producer
CREATE DATASHARE bi_share;
ALTER DATASHARE bi_share ADD SCHEMA reporting;
ALTER DATASHARE bi_share ADD TABLE reporting.fact_orders;
GRANT USAGE ON DATASHARE bi_share TO ACCOUNT '111122223333';
The schema has to be added before the tables inside it, which is a common first stumble. Cross-account sharing is a two-way handshake: the producer authorises the datashare, and an administrator in the consumer account associates it before anything is queryable. Both sides must be encrypted for cross-account sharing. Objects are read-only unless the producer explicitly grants write privileges and the consumer associates for writes, which is the behaviour you want for a BI audience.
Two things to price in. Cross-region sharing moves data and is billed accordingly. And the consumer warehouse doesn’t hold statistics on the producer’s data, so plan expectations around query planning rather than assuming parity with local tables.
The Iceberg REST catalog
If the consumer is another query engine rather than a dashboard tool, this is the interesting door. Amazon S3 Tables exposes an Iceberg REST endpoint at https://s3tables.<region>.amazonaws.com/iceberg, with your table bucket ARN as the warehouse location and SigV4 for authentication. Engines like Snowflake, Trino, StarRocks, Spark and PyIceberg can register that as an external catalog and read the tables in place.
Worth knowing: AWS positions the S3 Tables endpoint for basic read and write access against a single table bucket, and recommends the AWS Glue Iceberg REST endpoint when you need unified table management, centralised governance and fine-grained access control. If Lake Formation is already your control plane, go through Glue.
Where it doesn’t help: most BI tools don’t speak Iceberg REST. They speak SQL over JDBC. This is an engine-to-engine door, not a dashboard door, and treating it as the latter wastes a week.
A materialised extract
The unglamorous option that is frequently correct. Build a narrow, pre-aggregated table on a schedule and land it where the BI tool already keeps data: QuickSight SPICE, a Power BI import model, a Tableau extract, or a small Postgres instance. Tools like dbt handle the modelling side; Fivetran or Airbyte handle it if the source is a SaaS system rather than your own lake.
Where it wins: it is by a wide margin the cheapest and fastest option for stable reporting, because the expensive scan happens once per day instead of once per tile per user. If you self-host Metabase or Superset, a modest VPS from a provider like InterServer or Hetzner will comfortably serve a department off a nightly rollup.
Where it doesn’t: freshness. And you now own a pipeline that can fail silently, which is its own category of on-call pain.
Identity: the shared service role problem
Nearly every BI deployment starts with one IAM role for the whole tool. It works immediately, which is why it survives longer than it should.
The consequences accumulate quietly. CloudTrail records every query as the same principal, so audit answers stop being useful. Lake Formation row filters key off the principal, so if all traffic arrives as one role, your row-level security collapses to whatever that role can see. And cost attribution disappears, so when the bill jumps you cannot say which team caused it.
Three ways out, in increasing order of effort:
- One role and one Athena workgroup per consumer group. Coarse, but honest. Finance gets a role, marketing gets a role, each with its own workgroup. Scan volume becomes attributable and you can set different limits per audience.
- Real identity propagation. Federate the BI tool’s users through IAM Identity Center or SAML so Lake Formation grants apply to the actual person. This is the correct boundary and the most work, and driver and tool support varies. Test it with the exact tool version your users have before you promise it in a design review.
- Push the filter into the data. Per-tenant tables, views or partitions with separate grants. Unfashionable and more to maintain, but it works with every tool, survives driver upgrades, and keeps result reuse eligible because the tables themselves carry no filters.
Option three is the one I reach for first when the audience is a handful of stable groups, and option two when the audience is the whole company.
The network path is a design decision, not a checkbox
For a SaaS BI tool, the public service endpoint with SigV4-signed requests over TLS is perfectly reasonable, and it is what most vendors document. Don’t let anyone talk you into complexity you don’t need.
You need more when the tool runs inside a VPC, or on-premises via Direct Connect or VPN, and traffic must not traverse the internet. Athena supports an interface VPC endpoint, and the Athena documentation is explicit that you should pair it with an AWS Glue endpoint, because the catalog lookup is a separate API call that will otherwise still go out to the public endpoint.
aws ec2 create-vpc-endpoint
  --vpc-id <your-vpc-id>
  --service-name com.amazonaws.<region>.athena
  --vpc-endpoint-type Interface
  --subnet-ids <subnet-id>
  --security-group-ids <security-group-id>
  --private-dns-enabled
With private DNS enabled, the standard athena.<region>.amazonaws.com hostname resolves to the endpoint, so no client configuration changes. Without it, VPC gives you a hostname in the form <endpoint-id>.athena.<region>.vpce.amazonaws.com, which you have to configure in the tool by hand. Attach an endpoint policy while you’re there; that’s where you restrict which principals and resources can be reached.
For Redshift, the equivalent is a Redshift-managed VPC endpoint, which requires either RA3 node types or Redshift Serverless. On provisioned clusters, cluster relocation has to be enabled first.
One cost item people forget: if the BI tool lives outside AWS, every row it pulls back is data transfer out. A live dashboard returning aggregates is cheap. A nightly extract refresh dragging millions of rows across the boundary is not. Add an S3 gateway endpoint for the query results bucket so the driver’s result download stays on the AWS network where it can.
Cost levers, in the order they pay off
Ordering matters here. Most teams reach for the guardrails first, which bounds the worst case without improving the base case.
- Fix the storage layout. Columnar formats and sensible partitioning reduce bytes scanned on every query forever. Nothing else you do competes with this.
- Pre-aggregate for the dashboard. A tile that reads a purpose-built rollup is a different animal from one that scans a fact table and aggregates on the fly.
- Enable result reuse where governance allows it. Free wins on repeated queries, provided the tables aren’t disqualified by the limitations above.
- Give every consumer its own workgroup with a per-query cutoff. This is the guardrail, and it belongs after the first three, not before them.
- Move the highest-traffic dashboards to extract mode. Once a dashboard’s usage is predictable, importing beats querying live.
The workgroup guardrail in Terraform. The per-query cutoff cancels any single query that scans more than the limit, which is what stops an accidental SELECT * against a multi-terabyte table:
resource "aws_athena_workgroup" "bi_finance" {
  name  = "bi-finance"
  state = "ENABLED"

  configuration {
    enforce_workgroup_configuration    = true
    publish_cloudwatch_metrics_enabled = true
    bytes_scanned_cutoff_per_query     = 10737418240  # 10 GiB

    result_configuration {
      output_location = "s3://my-athena-results/bi-finance/"
    }
  }
}
Two flags there do real work. enforce_workgroup_configuration stops clients overriding the results location and encryption settings, which is what keeps a BI tool from writing results somewhere unmanaged. publish_cloudwatch_metrics_enabled is what makes the whole thing observable, and without it you’re back to reading the invoice to find out what happened.
Workgroup-wide limits are configured separately from the workgroup resource. Those let you set hourly or daily thresholds on aggregate data scanned and fire an SNS notification when a threshold is crossed, which can page someone or disable the workgroup outright.
Result reuse can be set per query through the API, which is the mechanism the drivers expose as a connection option:
aws athena start-query-execution
  --work-group "bi-finance"
  --query-string "SELECT region, SUM(net) FROM reporting.orders GROUP BY 1"
  --result-reuse-configuration
    "ResultReuseByAgeConfiguration={Enabled=true,MaxAgeInMinutes=60}"
Set the max age to match how often the underlying data actually changes. If the table is rebuilt once a night, an hour is far too conservative.
Finally, alarm on the scan metrics. Whether that lands in CloudWatch dashboards, Grafana or Datadog matters less than the alarm existing at all, owned by the team whose workgroup it is.
Troubleshooting the connections that half work
- The tool connects but lists no tables. Almost always Lake Formation rather than IAM. Check that the role has been granted on the database and tables, and note that the
DESCRIBEpermission on the default database is required for Athena. - “Bytes scanned limit exceeded.” That’s your per-query cutoff doing its job. Look at what the tile is actually querying before raising the limit. Usually the partition filter is missing.
- Query works in the console, fails from the tool. Three usual suspects: a different workgroup, a results location the role can’t write to, or a role that has catalog access but not S3 access to the underlying data.
- A view works for you but not for the analyst. Lake Formation requires permissions on the tables, columns and S3 locations the view is built on. Column-level permissions are not available on views, so a view is not a substitute for column filtering.
- Costs jumped with no deployment. Check whether anyone added Lake Formation filters, and check whether partition pruning quietly stopped working after a schema or layout change.
- The first query of the morning is slow, the rest are fine. Partition metadata listing. Partition projection removes most of that cost on large tables.
Common mistakes
- Granting the BI role broad S3 read access and calling it least privilege. It sees every bucket prefix it can list, catalog or not.
- Running every consumer through the default primary workgroup, which makes attribution and per-team limits impossible.
- Exposing raw fact tables to business users and expecting them to write efficient SQL. They will drag columns into a canvas, which is what the tool is for.
- Setting dashboard refresh schedules without asking how fresh the underlying data actually is. Refreshing hourly against a nightly-loaded table burns money for identical results.
- Promising row-level security through a shared service role. It will not behave the way the security review thinks it does.
- Skipping the Glue VPC endpoint after building the Athena one, then spending a day wondering why traffic still leaves the VPC.
Best practices worth the effort
- Create the workgroup, the role and the tag before you hand over the connection string, not after the first invoice.
- Publish a curated reporting layer. The BI tool should see purpose-built tables with business column names, not your raw landing zone.
- Decide consciously whether a dataset is governed by Lake Formation filters or optimised for caching, and document which, because the two do not coexist on one table.
- Apply cost allocation tags at creation time. Retrofitting them across a live estate is thankless work.
- Version the connection setup as code. Terraform for the workgroup, roles and endpoints; a short runbook for the driver install on the client side.
- Re-test the whole path after any driver upgrade. Authentication behaviour is the thing that changes between driver major versions.
Frequently asked questions
What is the fastest way to connect Power BI or Tableau to AWS data?
Athena over the Glue Data Catalog, using the Athena JDBC or ODBC driver. Catalogue the data, create a workgroup with a results bucket, create a role with catalog and S3 read access, install the driver on the client, connect. The connection itself is the easy part; the workgroup and role are what you’ll wish you had done deliberately.
Should I use Athena or Redshift for BI dashboards?
Athena if query volume is moderate, the data already lives in S3, and users can tolerate a few seconds per query. Redshift if you need high concurrency, consistently low latency, or you already run a warehouse and can share into a separate consumer endpoint. The honest test is whether your peak is a spike or a plateau: Athena handles spikes without idle cost, Redshift handles plateaus without per-query cost.
Does Lake Formation row-level security work with any BI tool?
The filtering itself is enforced by the query engine, so it works regardless of the tool. What varies is whether the tool can present each end user as a distinct principal. Through a single shared service role, every user gets the same filtered view, which is not what row-level security is for. Verify the identity path with your actual tool before designing around it.
Why did my Athena bill increase after enabling fine-grained access control?
Because query result reuse is not supported for tables with Lake Formation row or column filters, or where the S3 location is registered as a Lake Formation data location. Queries that were being served from cached results started scanning again. Nothing errors, which is why it takes a billing cycle to notice.
Do I need PrivateLink to connect a BI tool to AWS?
No, unless your requirements say traffic must not traverse the public internet, or the tool runs inside a VPC or on-premises network. Public endpoints with signed requests over TLS are the normal path for SaaS BI tools. Add interface endpoints when there’s a stated requirement, and remember to add the Glue endpoint alongside the Athena one.
Can BI tools read Amazon S3 Tables directly?
Indirectly. S3 Tables integrates with the Glue Data Catalog, so Athena, EMR and Redshift can query them, and any BI tool that connects through Athena inherits that. The Iceberg REST endpoint is aimed at query engines and Iceberg clients rather than dashboard tools, which generally expect a SQL connection instead.
Is QuickSight a better fit than an external BI tool?
It removes the network, driver and identity plumbing described above, and SPICE gives you an in-memory cache without building an extract pipeline. Against that, your organisation may already be committed to Tableau, Power BI or Looker for reasons that have nothing to do with infrastructure, and retraining an analytics team is a genuine cost. Evaluate it on that basis rather than on the connection mechanics alone.
The one thing to take away
When you connect BI tools to AWS data, the connection is not the project. The project is deciding, deliberately, which datasets are governed by fine-grained filters and which are optimised for repeated cheap reads, then giving every consumer its own role, workgroup and cost tag before anyone gets a connection string.
Do that and a surprise bill becomes a question with an answer. Skip it and you’ll be reading CloudTrail on a Friday afternoon trying to work out which dashboard scanned four terabytes, with no way to prove it.
Need help wiring this up properly?
This is a large part of what I do. If you’re opening up AWS data to an analytics team and want it done so it still makes sense in six months, I can help with:
- Choosing between Athena, a Redshift datashare, an Iceberg REST catalog or a scheduled extract for your specific query pattern and user count
- Setting up per-consumer IAM roles, Athena workgroups, scan limits and cost allocation tags as Terraform rather than console clicks
- Designing a Lake Formation permission model that gives you row and column security without silently destroying your caching
- Building the curated reporting layer and partition strategy that makes dashboards fast and cheap at the source
- Private network paths with interface VPC endpoints, Redshift-managed endpoints and endpoint policies for tools that can’t use public endpoints
- Diagnosing an Athena or Redshift bill that grew without an obvious cause, and putting alarms in place so it doesn’t happen twice
Send me a workgroup config, a slow dashboard query, or a Cost Explorer screenshot you can’t explain, and I’ll tell you what I’d look at first.